

Annual Report 1999 - Skanska
Annual Report 1999 - Skanska
Annual Report 1999 - Skanska

Create successful ePaper yourself
Turn your PDF publications into a flip-book with our unique Google optimized e-Paper software.
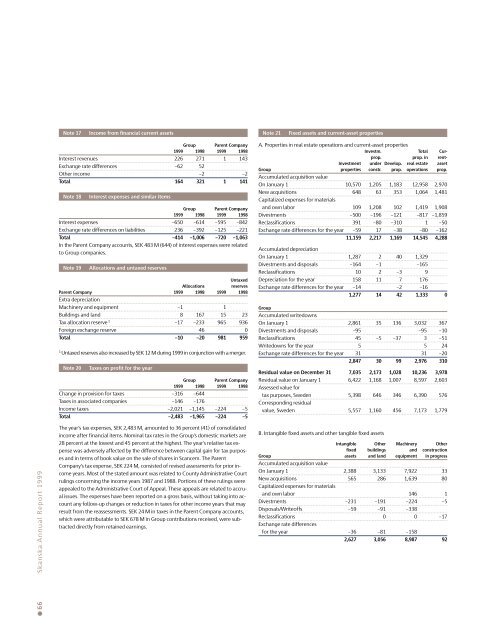
Note 17Income from financial current assetsNote 21Fixed assets and current-asset propertiesGroup Parent Company<strong>1999</strong> 1998 <strong>1999</strong> 1998Interest revenues 226 271 1 143Exchange rate differences –62 52Other income –2 –2Total 164 321 1 141Note 18Interest expenses and similar itemsGroup Parent Company<strong>1999</strong> 1998 <strong>1999</strong> 1998Interest expenses –650 –614 –595 –842Exchange rate differences on liabilities 236 –392 –125 –221Total –414 –1,006 –720 –1,063In the Parent Company accounts, SEK 483 M (644) of interest expenses were relatedto Group companies.Note 19Allocations and untaxed reservesUntaxedAllocationsreservesParent Company <strong>1999</strong> 1998 <strong>1999</strong> 1998Extra depreciationMachinery and equipment –1 1Buildings and land 8 167 15 23Tax allocation reserve 1 –17 –233 965 936Foreign exchange reserve 46 0Total –10 –20 981 9591Untaxed reserves also increased by SEK 12 M during <strong>1999</strong> in conjunction with a merger.Note 20Taxes on profit for the yearGroup Parent Company<strong>1999</strong> 1998 <strong>1999</strong> 1998Change in provision for taxes –316 –644Taxes in associated companies –146 –176Income taxes –2,021 –1,145 –224 –5Total –2,483 –1,965 –224 –5A. Properties in real estate operations and current-asset propertiesInvestm. Total Curprop.prop. in rent-Investment under Develop. real estate assetGroup properties constr. prop. operations prop.Accumulated acquisition valueOn January 1 10,570 1,205 1,183 12,958 2,970New acquisitions 648 63 353 1,064 1,481Capitalized expenses for materialsand own labor 109 1,208 102 1,419 1,908Divestments –500 –196 –121 –817 –1,859Reclassifications 391 –80 –310 1 –50Exchange rate differences for the year –59 17 –38 –80 –16211,159 2,217 1,169 14,545 4,288Accumulated depreciationOn January 1 1,287 2 40 1,329Divestments and disposals –164 –1 –165Reclassifications 10 2 –3 9Depreciation for the year 158 11 7 176Exchange rate differences for the year –14 –2 –161,277 14 42 1,333 0GroupAccumulated writedownsOn January 1 2,861 35 136 3,032 367Divestments and disposals –95 –95 –10Reclassifications 45 –5 –37 3 –51Writedowns for the year 5 5 24Exchange rate differences for the year 31 31 –202,847 30 99 2,976 310Residual value on December 31 7,035 2,173 1,028 10,236 3,978Residual value on January 1 6,422 1,168 1,007 8,597 2,603Assessed value fortax purposes, Sweden 5,398 646 346 6,390 576Corresponding residualvalue, Sweden 5,557 1,160 456 7,173 1,779● 66 <strong>Skanska</strong> <strong>Annual</strong> <strong>Report</strong> <strong>1999</strong>The year’s tax expenses, SEK 2,483 M, amounted to 36 percent (41) of consolidatedincome after financial items. Nominal tax rates in the Group’s domestic markets are28 percent at the lowest and 45 percent at the highest. The year’s relative tax expensewas adversely affected by the difference between capital gain for tax purposesand in terms of book value on the sale of shares in Scancem. The ParentCompany’s tax expense, SEK 224 M, consisted of revised assessments for prior incomeyears. Most of the stated amount was related to County Administrative Courtrulings concerning the income years 1987 and 1988. Portions of these rulings wereappealed to the Administrative Court of Appeal. These appeals are related to accrualissues. The expenses have been reported on a gross basis, without taking into accountany follow-up changes or reduction in taxes for other income years that mayresult from the reassessments. SEK 24 M in taxes in the Parent Company accounts,which were attributable to SEK 678 M in Group contributions received, were subtracteddirectly from retained earnings.B. Intangible fixed assets and other tangible fixed assetsIntangible Other Machinery Otherfixed buildings and constructionGroup assets and land equipment in progressAccumulated acquisition valueOn January 1 2,388 3,133 7,922 33New acquisitions 565 286 1,639 80Capitalized expenses for materialsand own labor 146 1Divestments –231 –191 –224 –5Disposals/Writeoffs –59 –91 –338Reclassifications 0 0 –17Exchange rate differencesfor the year –36 –81 –1582,627 3,056 8,987 92


