

Annual Report 1999 - Skanska
Annual Report 1999 - Skanska
Annual Report 1999 - Skanska

You also want an ePaper? Increase the reach of your titles
YUMPU automatically turns print PDFs into web optimized ePapers that Google loves.
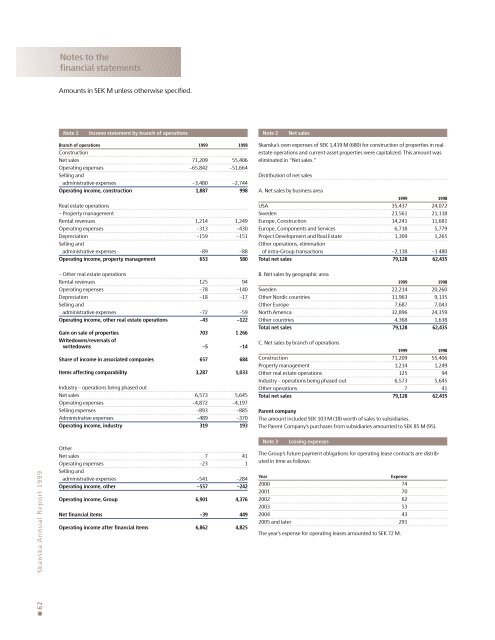
Notes to thefinancial statementsAmounts in SEK M unless otherwise specified.Note 1Income statement by branch of operationsNote 2Net salesBranch of operations <strong>1999</strong> 1998ConstructionNet sales 71,209 55,406Operating expenses –65,842 –51,664Selling andadministrative expenses –3,480 –2,744Operating income, construction 1,887 998Real estate operations– Property managementRental revenues 1,214 1,249Operating expenses –313 –430Depreciation –159 –151Selling andadministrative expenses –89 –88Operating income, property management 653 580<strong>Skanska</strong>’s own expenses of SEK 1,419 M (680) for construction of properties in realestate operations and current-asset properties were capitalized. This amount waseliminated in “Net sales.”Distribution of net salesA. Net sales by business area<strong>1999</strong> 1998USA 35,437 24,072Sweden 23,561 21,118Europe, Construction 14,241 11,681Europe, Components and Services 6,718 5,779Project Development and Real Estate 1,309 1,265Other operations, eliminationof intra-Group transactions –2,138 –1 480Total net sales 79,128 62,435– Other real estate operationsRental revenues 125 94Operating expenses –78 –140Depreciation –18 –17Selling andadministrative expenses –72 –59Operating income, other real estate operations –43 –122Gain on sale of properties 703 1 266Writedowns/reversals ofwritedowns –5 –14Share of income in associated companies 657 684Items affecting comparability 3,287 1,033Industry – operations being phased outNet sales 6,573 5,645Operating expenses –4,872 –4,197Selling expenses –893 –885Administrative expenses –489 –370Operating income, industry 319 193B. Net sales by geographic area<strong>1999</strong> 1998Sweden 22,214 20,260Other Nordic countries 11,963 9,135Other Europe 7,687 7,043North America 32,896 24,359Other countries 4,368 1,638Total net sales 79,128 62,435C. Net sales by branch of operations<strong>1999</strong> 1998Construction 71,209 55,406Property management 1,214 1,249Other real estate operations 125 94Industry – operations being phased out 6,573 5,645Other operations 7 41Total net sales 79,128 62,435Parent companyThe amount included SEK 103 M (18) worth of sales to subsidiaries.The Parent Company’s purchases from subsidiaries amounted to SEK 85 M (95).● 62 <strong>Skanska</strong> <strong>Annual</strong> <strong>Report</strong> <strong>1999</strong>OtherNet sales 7 41Operating expenses –23 1Selling andadministrative expenses –541 –284Operating income, other –557 –242Operating income, Group 6,901 4,376Net financial items –39 449Operating income after financial items 6,862 4,825Note 3Leasing expensesThe Group’s future payment obligations for operating lease contracts are distributedin time as follows:YearExpense2000 742001 702002 622003 532004 432005 and later 291The year’s expense for operating leases amounted to SEK 72 M.


