

Annual Report 1999 - Skanska
Annual Report 1999 - Skanska
Annual Report 1999 - Skanska

Create successful ePaper yourself
Turn your PDF publications into a flip-book with our unique Google optimized e-Paper software.
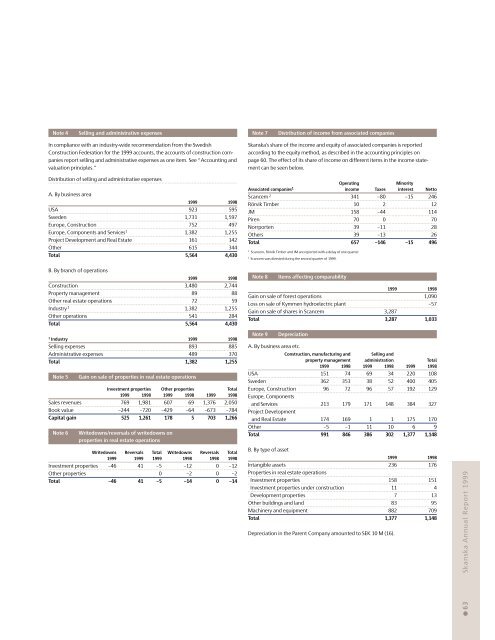
Note 4Selling and administrative expensesNote 7Distribution of income from associated companiesIn compliance with an industry-wide recommendation from the SwedishConstruction Federation for the <strong>1999</strong> accounts, the accounts of construction companiesreport selling and administrative expenses as one item. See “Accounting andvaluation principles.”Distribution of selling and administrative expensesA. By business area<strong>1999</strong> 1998USA 923 595Sweden 1,731 1,597Europe, Construction 752 497Europe, Components and Services 1 1,382 1,255Project Development and Real Estate 161 142Other 615 344Total 5,564 4,430<strong>Skanska</strong>’s share of the income and equity of associated companies is reportedaccording to the equity method, as described in the accounting principles onpage 60. The effect of its share of income on different items in the income statementcan be seen below.OperatingMinorityAssociated companies 1 income Taxes interest NettoScancem 2 341 –80 –15 246Rörvik Timber 10 2 12JM 158 –44 114Piren 70 0 70Norrporten 39 –11 28Others 39 –13 26Total 657 –146 –15 4961 Scancem, Rörvik Timber and JM are reported with a delay of one quarter.2 Scancem was divested during the second quarter of <strong>1999</strong>.B. By branch of operations<strong>1999</strong> 1998Construction 3,480 2,744Property management 89 88Other real estate operations 72 59Industry 1 1,382 1,255Other operations 541 284Total 5,564 4,4301 Industry <strong>1999</strong> 1998Selling expenses 893 885Administrative expenses 489 370Total 1,382 1,255Note 5Gain on sale of properties in real estate operationsInvestment properties Other properties Total<strong>1999</strong> 1998 <strong>1999</strong> 1998 <strong>1999</strong> 1998Sales revenues 769 1,981 607 69 1,376 2,050Book value –244 –720 –429 –64 –673 –784Capital gain 525 1,261 178 5 703 1,266Note 6Writedowns/reversals of writedowns onproperties in real estate operationsWritedowns Reversals Total Writedowns Reversals Total<strong>1999</strong> <strong>1999</strong> <strong>1999</strong> 1998 1998 1998Investment properties –46 41 –5 –12 0 –12Other properties 0 –2 0 –2Total –46 41 –5 –14 0 –14Note 8Items affecting comparability<strong>1999</strong> 1998Gain on sale of forest operations 1,090Loss on sale of Kymmen hydroelectric plant –57Gain on sale of shares in Scancem 3,287Total 3,287 1,033Note 9DepreciationA. By business area etc.Construction, manufacturing and Selling andproperty management administration Total<strong>1999</strong> 1998 <strong>1999</strong> 1998 <strong>1999</strong> 1998USA 151 74 69 34 220 108Sweden 362 353 38 52 400 405Europe, Construction 96 72 96 57 192 129Europe, Componentsand Services 213 179 171 148 384 327Project Developmentand Real Estate 174 169 1 1 175 170Other –5 –1 11 10 6 9Total 991 846 386 302 1,377 1,148B. By type of asset<strong>1999</strong> 1998Intangible assets 236 176Properties in real estate operationsInvestment properties 158 151Investment properties under construction 11 4Development properties 7 13Other buildings and land 83 95Machinery and equipment 882 709Total 1,377 1,148Depreciation in the Parent Company amounted to SEK 10 M (16).● 63 <strong>Skanska</strong> <strong>Annual</strong> <strong>Report</strong> <strong>1999</strong>


