

Annual Report 1999 - Skanska
Annual Report 1999 - Skanska
Annual Report 1999 - Skanska

Create successful ePaper yourself
Turn your PDF publications into a flip-book with our unique Google optimized e-Paper software.
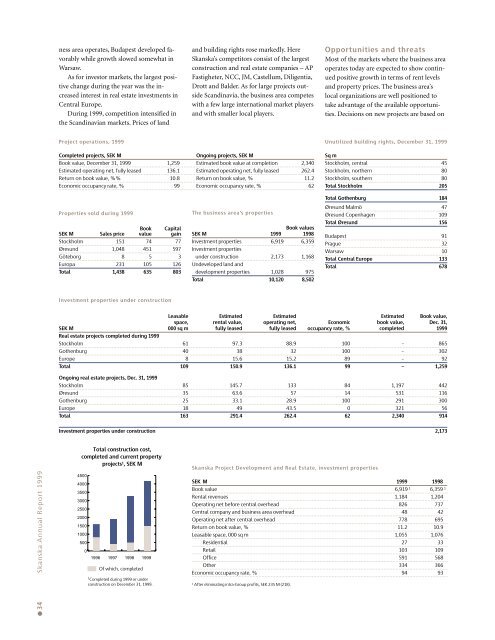
ness area operates, Budapest developed favorablywhile growth slowed somewhat inWarsaw.As for investor markets, the largest positivechange during the year was the increasedinterest in real estate investments inCentral Europe.During <strong>1999</strong>, competition intensified inthe Scandinavian markets. Prices of landand building rights rose markedly. Here<strong>Skanska</strong>’s competitors consist of the largestconstruction and real estate companies – APFastigheter, NCC, JM, Castellum, Diligentia,Drott and Balder. As for large projects outsideScandinavia, the business area competeswith a few large international market playersand with smaller local players.Opportunities and threatsMost of the markets where the business areaoperates today are expected to show continuedpositive growth in terms of rent levelsand property prices. The business area’slocal organizations are well positioned totake advantage of the available opportunities.Decisions on new projects are based onProject operations, <strong>1999</strong>Unutilized building rights, December 31, <strong>1999</strong>Completed projects, SEK MOngoing projects, SEK MBook value, December 31, <strong>1999</strong> 1,259 Estimated book value at completion 2,340Estimated operating net, fully leased 136.1 Estimated operating net, fully leased 262.4Return on book value, %% 10.8 Return on book value, % 11.2Economic occupancy rate, % 99 Economic occupancy rate, % 62Sq mStockholm, central 45Stockholm, northern 80Stockholm, southern 80Total Stockholm 205Properties sold during <strong>1999</strong>Book CapitalSEK M Sales price value gainStockholm 151 74 77Øresund 1,048 451 597Göteborg 8 5 3Europa 231 105 126Total 1,438 635 803The business area’s propertiesBook valuesSEK M <strong>1999</strong> 1998Investment properties 6,919 6,359Investment propertiesunder construction 2,173 1,168Undeveloped land anddevelopment properties 1,028 975Total 10,120 8,502Total Gothenburg 184Øresund Malmö 47Øresund Copenhagen 109Total Øresund 156Budapest 91Prague 32Warsaw 10Total Central Europe 133Total 678Investment properties under constructionLeasable Estimated Estimated Estimated Book value,space, rental value, operating net, Economic book value, Dec. 31,SEK M 000 sq m fully leased fully leased occupancy rate, % completed <strong>1999</strong>Real estate projects completed during <strong>1999</strong>Stockholm 61 97.3 88.9 100 – 865Gothenburg 40 38 32 100 – 302Europe 8 15.6 15.2 89 – 92Total 109 150.9 136.1 99 – 1,259Ongoing real estate projects, Dec. 31, <strong>1999</strong>Stockholm 85 145.7 133 84 1,197 442Øresund 35 63.6 57 14 531 116Gothenburg 25 33.1 28.9 100 291 300Europe 18 49 43.5 0 321 56Total 163 291.4 262.4 62 2,340 914Investment properties under construction 2,173● 34 <strong>Skanska</strong> <strong>Annual</strong> <strong>Report</strong> <strong>1999</strong>Total construction cost,completed and current propertyprojects 1 , SEK M450040003500300025002000150010005000199619971998Of which, completed<strong>1999</strong>1 Completed during <strong>1999</strong> or underconstruction on December 31, <strong>1999</strong>.450040003500300025002000150010005000<strong>Skanska</strong> Project Development and Real Estate, investment propertiesSEK M <strong>1999</strong> 1998Book value 6,919 1 6,359 1Rental revenues 1,184 1,204Operating net before central overhead 826 737Central company and business area overhead 48 42Operating net after central overhead 778 695Return on book value, % 11.2 10.9Leasable space, 000 sq m 1,055 1,076Residential 27 33Retail 103 109Office 591 568Other 334 366Economic occupancy rate, % 94 931 After eliminating intra-Group profits, SEK 235 M (218).


