Annual Report 1999 - Skanska
Annual Report 1999 - Skanska
Annual Report 1999 - Skanska
You also want an ePaper? Increase the reach of your titles
YUMPU automatically turns print PDFs into web optimized ePapers that Google loves.
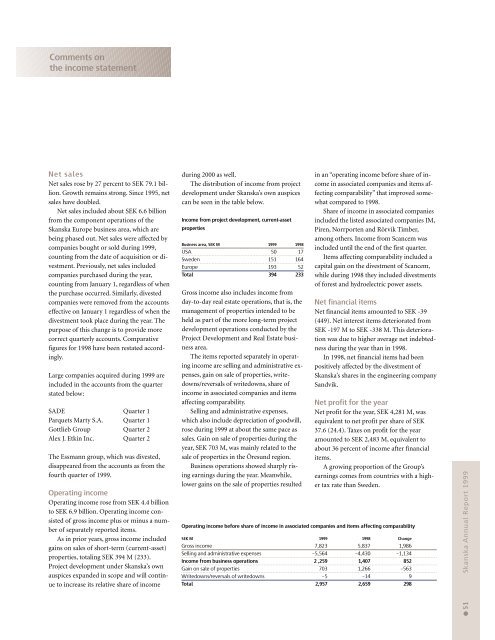
Comments onthe income statementNet salesNet sales rose by 27 percent to SEK 79.1 billion.Growth remains strong. Since 1995, netsales have doubled.Net sales included about SEK 6.6 billionfrom the component operations of the<strong>Skanska</strong> Europe business area, which arebeing phased out. Net sales were affected bycompanies bought or sold during <strong>1999</strong>,counting from the date of acquisition or divestment.Previously, net sales includedcompanies purchased during the year,counting from January 1, regardless of whenthe purchase occurred. Similarly, divestedcompanies were removed from the accountseffective on January 1 regardless of when thedivestment took place during the year. Thepurpose of this change is to provide morecorrect quarterly accounts. Comparativefigures for 1998 have been restated accordingly.Large companies acquired during <strong>1999</strong> areincluded in the accounts from the quarterstated below:SADE Quarter 1Parquets Marty S.A. Quarter 1Gottlieb Group Quarter 2Alex J. Etkin Inc. Quarter 2The Essmann group, which was divested,disappeared from the accounts as from thefourth quarter of <strong>1999</strong>.Operating incomeOperating income rose from SEK 4.4 billionto SEK 6.9 billion. Operating income consistedof gross income plus or minus a numberof separately reported items.As in prior years, gross income includedgains on sales of short-term (current-asset)properties, totaling SEK 394 M (233).Project development under <strong>Skanska</strong>’s ownauspices expanded in scope and will continueto increase its relative share of incomeduring 2000 as well.The distribution of income from projectdevelopment under <strong>Skanska</strong>’s own auspicescan be seen in the table below.Income from project development, current-assetpropertiesBusiness area, SEK M <strong>1999</strong> 1998USA 50 17Sweden 151 164Europe 193 52Total 394 233Gross income also includes income fromday-to-day real estate operations, that is, themanagement of properties intended to beheld as part of the more long-term projectdevelopment operations conducted by theProject Development and Real Estate businessarea.The items reported separately in operatingincome are selling and administrative expenses,gain on sale of properties, writedowns/reversalsof writedowns, share ofincome in associated companies and itemsaffecting comparability.Selling and administrative expenses,which also include depreciation of goodwill,rose during <strong>1999</strong> at about the same pace assales. Gain on sale of properties during theyear, SEK 703 M, was mainly related to thesale of properties in the Öresund region.Business operations showed sharply risingearnings during the year. Meanwhile,lower gains on the sale of properties resultedin an “operating income before share of incomein associated companies and items affectingcomparability” that improved somewhatcompared to 1998.Share of income in associated companiesincluded the listed associated companies JM,Piren, Norrporten and Rörvik Timber,among others. Income from Scancem wasincluded until the end of the first quarter.Items affecting comparability included acapital gain on the divestment of Scancem,while during 1998 they included divestmentsof forest and hydroelectric power assets.Net financial itemsNet financial items amounted to SEK -39(449). Net interest items deteriorated fromSEK -197 M to SEK -338 M. This deteriorationwas due to higher average net indebtednessduring the year than in 1998.In 1998, net financial items had beenpositively affected by the divestment of<strong>Skanska</strong>’s shares in the engineering companySandvik.Net profit for the yearNet profit for the year, SEK 4,281 M, wasequivalent to net profit per share of SEK37.6 (24.4). Taxes on profit for the yearamounted to SEK 2,483 M, equivalent toabout 36 percent of income after financialitems.A growing proportion of the Group’searnings comes from countries with a highertax rate than Sweden.Operating income before share of income in associated companies and items affecting comparabilitySEK M <strong>1999</strong> 1998 ChangeGross income 7,823 5,837 1,986Selling and administrative expenses –5,564 –4,430 –1,134Income from business operations 2 ,259 1,407 852Gain on sale of properties 703 1,266 –563Writedowns/reversals of writedowns –5 –14 9Total 2,957 2,659 298● 51 <strong>Skanska</strong> <strong>Annual</strong> <strong>Report</strong> <strong>1999</strong>


