Laporan Akhir Projek Penyelidikan Jangka Pendek ... - ePrints@USM
Laporan Akhir Projek Penyelidikan Jangka Pendek ... - ePrints@USM
Laporan Akhir Projek Penyelidikan Jangka Pendek ... - ePrints@USM

You also want an ePaper? Increase the reach of your titles
YUMPU automatically turns print PDFs into web optimized ePapers that Google loves.
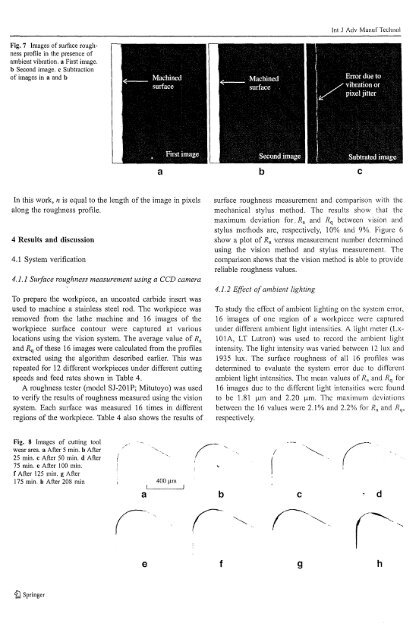
Int J Adv ManuI' TechnolFig. 7 Images of surface roughnessprofile in the presence ofambient vibration. a First image.b Second image. c Subtractionof images in a and ba b cIn this work, n is equal to the length of the image in pixelsalong the roughness profile.4 Results and discussion4.1 System verification4.1.1 Surface roughness measurement using a CCD cameraTo prepare the workpiece, an uncoated carbide insert wasused to machine a stainless steel rod. The workpiece wasremoved from the lathe machine and 16 images of theworkpiece surface contour were captured at variouslocations using the vision system. The average value of R aand R q ofthese 16 images were calculated from the profilesextracted using the algorithm described earlier. This wasrepeated for 12 different workpieces under different cuttingspeeds and feed rates shown in Table 4.A roughness tester (model SJ-201P; Mitutoyo) was usedto verify the results of roughness measured using the visionsystem. Each surface was measured 16 times in differentregions of the workpiece. Table 4 also shows the results ofsurface roughness measurement and comparison with themechanical stylus method. The results show that themaximum deviation fOL R a and R q between vision andstylus methods are, respectively, 10% and 9%. Figure 6show a plot of R a v.ersus measurement number detetminedusing the vision method and stylus measurement. Thecomparison shows that the vision method is able to providereliable roughness values.4.1.2 Effect ofambient lightingTo study the effect of ambient lighting on the system error,16 images of one region of a workpiece were capturedunder different ambient light intensities. A light meter (LxlOlA,LT Lutron) was used to record the ambient lightintensity. The light intensity was varied between 12 lux and1935 lux. The surface roughness of all 16 profiles wasdetetmined to evaluate the system error due to differentambient light intensities. The mean values of R a and R q for16 images due to the different light intensities were foundto be 1.81 }-Lm and 2.20 }-Lm. The maximum deviationsbetween the 16 values were 2.1 % and 2.2% for R a and R,prespectively.Fig. 8 Images of cutting toolwear area. a After 5 min. b After25 min. c After 50 min. dAfter75 min. e After 100 min.f After 125 min. g After175 min. h After 208 mina400 )lmb!rcde f 9 h1d Springer