

PRIVATIZATION Privatization in Malaysia, Regulation, rent-seeking and policy failure
PRIVATIZATION Privatization in Malaysia, Regulation, rent-seeking and policy failure
PRIVATIZATION Privatization in Malaysia, Regulation, rent-seeking and policy failure

Create successful ePaper yourself
Turn your PDF publications into a flip-book with our unique Google optimized e-Paper software.
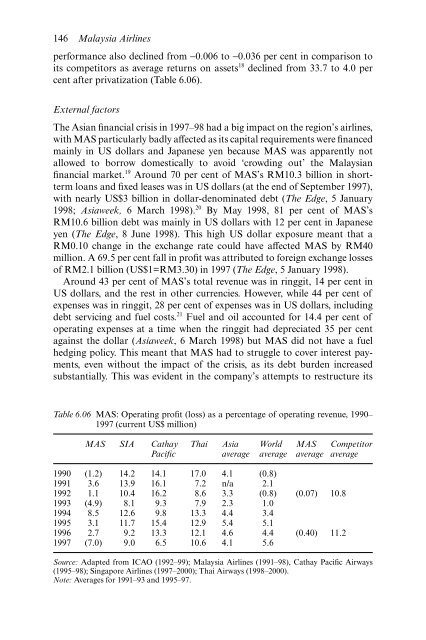
146 <strong>Malaysia</strong> Airl<strong>in</strong>esperformance also decl<strong>in</strong>ed from −0.006 to −0.036 per cent <strong>in</strong> comparison toits competitors as average returns on assets 18 decl<strong>in</strong>ed from 33.7 to 4.0 percent after privatization (Table 6.06).External factorsThe Asian f<strong>in</strong>ancial crisis <strong>in</strong> 1997–98 had a big impact on the region’s airl<strong>in</strong>es,with MAS particularly badly affected as its capital requirements were f<strong>in</strong>ancedma<strong>in</strong>ly <strong>in</strong> US dollars <strong>and</strong> Japanese yen because MAS was appa<strong>rent</strong>ly notallowed to borrow domestically to avoid ‘crowd<strong>in</strong>g out’ the <strong>Malaysia</strong>nf<strong>in</strong>ancial market. 19 Around 70 per cent of MAS’s RM10.3 billion <strong>in</strong> shorttermloans <strong>and</strong> fixed leases was <strong>in</strong> US dollars (at the end of September 1997),with nearly US$3 billion <strong>in</strong> dollar-denom<strong>in</strong>ated debt (The Edge, 5 January1998; Asiaweek, 6 March 1998). 20 By May 1998, 81 per cent of MAS’sRM10.6 billion debt was ma<strong>in</strong>ly <strong>in</strong> US dollars with 12 per cent <strong>in</strong> Japaneseyen (The Edge, 8 June 1998). This high US dollar exposure meant that aRM0.10 change <strong>in</strong> the exchange rate could have affected MAS by RM40million. A 69.5 per cent fall <strong>in</strong> profit was attributed to foreign exchange lossesof RM2.1 billion (US$1=RM3.30) <strong>in</strong> 1997 (The Edge, 5 January 1998).Around 43 per cent of MAS’s total revenue was <strong>in</strong> r<strong>in</strong>ggit, 14 per cent <strong>in</strong>US dollars, <strong>and</strong> the rest <strong>in</strong> other currencies. However, while 44 per cent ofexpenses was <strong>in</strong> r<strong>in</strong>ggit, 28 per cent of expenses was <strong>in</strong> US dollars, <strong>in</strong>clud<strong>in</strong>gdebt servic<strong>in</strong>g <strong>and</strong> fuel costs. 21 Fuel <strong>and</strong> oil accounted for 14.4 per cent ofoperat<strong>in</strong>g expenses at a time when the r<strong>in</strong>ggit had depreciated 35 per centaga<strong>in</strong>st the dollar (Asiaweek, 6 March 1998) but MAS did not have a fuelhedg<strong>in</strong>g <strong>policy</strong>. This meant that MAS had to struggle to cover <strong>in</strong>terest payments,even without the impact of the crisis, as its debt burden <strong>in</strong>creasedsubstantially. This was evident <strong>in</strong> the company’s attempts to restructure itsTable 6.06 MAS: Operat<strong>in</strong>g profit (loss) as a percentage of operat<strong>in</strong>g revenue, 1990–1997 (cur<strong>rent</strong> US$ million)MAS SIA CathayPacificThaiAsiaaverageWorldaverageMASaverageCompetitoraverage1990 (1.2) 14.2 14.1 17.0 4.1 (0.8)1991 3.6 13.9 16.1 7.2 n/a 2.11992 1.1 10.4 16.2 8.6 3.3 (0.8) (0.07) 10.81993 (4.9) 8.1 9.3 7.9 2.3 1.01994 8.5 12.6 9.8 13.3 4.4 3.41995 3.1 11.7 15.4 12.9 5.4 5.11996 2.7 9.2 13.3 12.1 4.6 4.4 (0.40) 11.21997 (7.0) 9.0 6.5 10.6 4.1 5.6Source: Adapted from ICAO (1992–99); <strong>Malaysia</strong> Airl<strong>in</strong>es (1991–98), Cathay Pacific Airways(1995–98); S<strong>in</strong>gapore Airl<strong>in</strong>es (1997–2000); Thai Airways (1998–2000).Note: Averages for 1991–93 <strong>and</strong> 1995–97.