Annual report and financial statement 2009 - United Utilities
Annual report and financial statement 2009 - United Utilities
Annual report and financial statement 2009 - United Utilities

You also want an ePaper? Increase the reach of your titles
YUMPU automatically turns print PDFs into web optimized ePapers that Google loves.
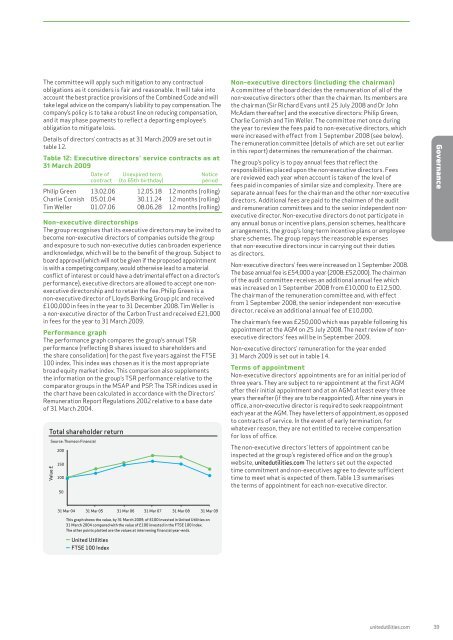
The committee will apply such mitigation to any contractualobligations as it considers is fair <strong>and</strong> reasonable. It will take intoaccount the best practice provisions of the Combined Code <strong>and</strong> willtake legal advice on the company’s liability to pay compensation. Thecompany’s policy is to take a robust line on reducing compensation,<strong>and</strong> it may phase payments to reflect a departing employee’sobligation to mitigate loss.Details of directors’ contracts as at 31 March <strong>2009</strong> are set out intable 12.Table 12: Executive directors’ service contracts as at31 March <strong>2009</strong>Date of Unexpired term Noticecontract (to 65th birthday) periodPhilip Green 13.02.06 12.05.18 12 months (rolling)Charlie Cornish 05.01.04 30.11.24 12 months (rolling)Tim Weller 01.07.06 08.06.28 12 months (rolling)Non-executive directorshipsThe group recognises that its executive directors may be invited tobecome non-executive directors of companies outside the group<strong>and</strong> exposure to such non-executive duties can broaden experience<strong>and</strong> knowledge, which will be to the benefit of the group. Subject toboard approval (which will not be given if the proposed appointmentis with a competing company, would otherwise lead to a materialconflict of interest or could have a detrimental effect on a director’sperformance), executive directors are allowed to accept one nonexecutivedirectorship <strong>and</strong> to retain the fee. Philip Green is anon-executive director of Lloyds Banking Group plc <strong>and</strong> received£100,000 in fees in the year to 31 December 2008. Tim Weller isa non-executive director of the Carbon Trust <strong>and</strong> received £21,000in fees for the year to 31 March <strong>2009</strong>.Performance graphThe performance graph compares the group’s annual TSRperformance (reflecting B shares issued to shareholders <strong>and</strong>the share consolidation) for the past five years against the FTSE100 index. This index was chosen as it is the most appropriatebroad equity market index. This comparison also supplementsthe information on the group’s TSR performance relative to thecomparator groups in the MSAP <strong>and</strong> PSP. The TSR indices used inthe chart have been calculated in accordance with the Directors’Remuneration Report Regulations 2002 relative to a base dateof 31 March 2004.Total shareholder returnSource: Thomson FinancialSource: Thomson FinancialValue £20015010050Non-executive directors (including the chairman)A committee of the board decides the remuneration of all of thenon-executive directors other than the chairman. Its members arethe chairman (Sir Richard Evans until 25 July 2008 <strong>and</strong> Dr JohnMcAdam thereafter) <strong>and</strong> the executive directors: Philip Green,Charlie Cornish <strong>and</strong> Tim Weller. The committee met once duringthe year to review the fees paid to non-executive directors, whichwere increased with effect from 1 September 2008 (see below).The remuneration committee (details of which are set out earlierin this <strong>report</strong>) determines the remuneration of the chairman.The group’s policy is to pay annual fees that reflect theresponsibilities placed upon the non-executive directors. Feesare reviewed each year when account is taken of the level offees paid in companies of similar size <strong>and</strong> complexity. There areseparate annual fees for the chairman <strong>and</strong> the other non-executivedirectors. Additional fees are paid to the chairmen of the audit<strong>and</strong> remuneration committees <strong>and</strong> to the senior independent nonexecutivedirector. Non-executive directors do not participate inany annual bonus or incentive plans, pension schemes, healthcarearrangements, the group’s long-term incentive plans or employeeshare schemes. The group repays the reasonable expensesthat non-executive directors incur in carrying out their dutiesas directors.Non-executive directors’ fees were increased on 1 September 2008.The base annual fee is £54,000 a year (2008: £52,000). The chairmanof the audit committee receives an additional annual fee whichwas increased on 1 September 2008 from £10,000 to £12,500.The chairman of the remuneration committee <strong>and</strong>, with effectfrom 1 September 2008, the senior independent non-executivedirector, receive an additional annual fee of £10,000.The chairman’s fee was £250,000 which was payable following hisappointment at the AGM on 25 July 2008. The next review of nonexecutivedirectors’ fees will be in September <strong>2009</strong>.Non-executive directors’ remuneration for the year ended31 March <strong>2009</strong> is set out in table 14.Terms of appointmentNon-executive directors’ appointments are for an initial period ofthree years. They are subject to re-appointment at the first AGMafter their initial appointment <strong>and</strong> at an AGM at least every threeyears thereafter (if they are to be reappointed). After nine years inoffice, a non-executive director is required to seek reappointmenteach year at the AGM. They have letters of appointment, as opposedto contracts of service. In the event of early termination, forwhatever reason, they are not entitled to receive compensationfor loss of office.The non-executive directors’ letters of appointment can beinspected at the group’s registered office <strong>and</strong> on the group’swebsite, unitedutilities.com The letters set out the expectedtime commitment <strong>and</strong> non-executives agree to devote sufficienttime to meet what is expected of them. Table 13 summarisesthe terms of appointment for each non-executive director.Governance31 Mar 04 31 Mar 05 31 Mar 06 31 Mar 07 31 Mar 08 31 Mar 09This graph shows the value, by 31 March <strong>2009</strong>, of £100 invested in <strong>United</strong> <strong>Utilities</strong> on31 March 2004 compared with the value of £100 invested in the FTSE 100 Index.The other points plotted are the values at intervening <strong>financial</strong> year-ends.<strong>United</strong> <strong>Utilities</strong>FTSE 100 Indexunitedutilities.com 39