Annual report and financial statement 2009 - United Utilities
Annual report and financial statement 2009 - United Utilities
Annual report and financial statement 2009 - United Utilities

You also want an ePaper? Increase the reach of your titles
YUMPU automatically turns print PDFs into web optimized ePapers that Google loves.
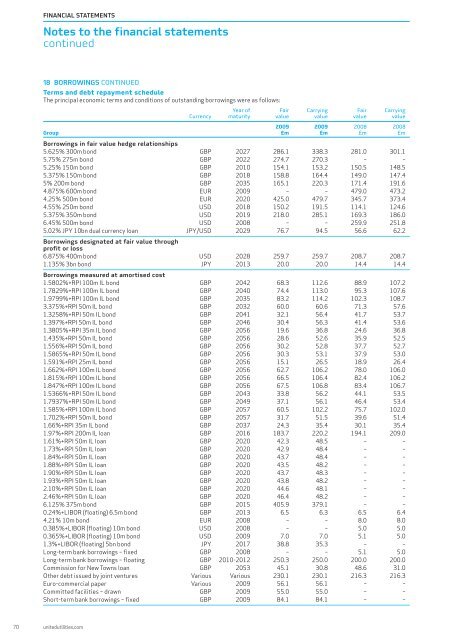
FINANCIAL STATEMENTSNotes to the <strong>financial</strong> <strong>statement</strong>scontinued18 BORROWINGS CONTINUEDTerms <strong>and</strong> debt repayment scheduleThe principal economic terms <strong>and</strong> conditions of outst<strong>and</strong>ing borrowings were as follows:Year of Fair Carrying Fair CarryingCurrency maturity value value value value<strong>2009</strong> <strong>2009</strong> 2008 2008Group £m £m £m £mBorrowings in fair value hedge relationships5.625% 300m bond GBP 2027 286.1 338.3 281.0 301.15.75% 275m bond GBP 2022 274.7 270.3 – –5.25% 150m bond GBP 2010 154.1 153.2 150.5 148.55.375% 150m bond GBP 2018 158.8 164.4 149.0 147.45% 200m bond GBP 2035 165.1 220.3 171.4 191.64.875% 600m bond EUR <strong>2009</strong> – – 479.0 473.24.25% 500m bond EUR 2020 425.0 479.7 345.7 373.44.55% 250m bond USD 2018 150.2 191.5 114.1 124.65.375% 350m bond USD 2019 218.0 285.1 169.3 186.06.45% 500m bond USD 2008 – – 259.9 251.85.02% JPY 10bn dual currency loan JPY/USD 2029 76.7 94.5 56.6 62.2Borrowings designated at fair value throughprofit or loss6.875% 400m bond USD 2028 259.7 259.7 208.7 208.71.135% 3bn bond JPY 2013 20.0 20.0 14.4 14.4Borrowings measured at amortised cost1.5802%+RPI 100m IL bond GBP 2042 68.3 112.6 88.9 107.21.7829%+RPI 100m IL bond GBP 2040 74.4 113.0 95.3 107.61.9799%+RPI 100m IL bond GBP 2035 83.2 114.2 102.3 108.73.375%+RPI 50m IL bond GBP 2032 60.0 60.6 71.3 57.61.3258%+RPI 50m IL bond GBP 2041 32.1 56.4 41.7 53.71.397%+RPI 50m IL bond GBP 2046 30.4 56.3 41.4 53.61.3805%+RPI 35m IL bond GBP 2056 19.6 36.8 24.6 36.81.435%+RPI 50m IL bond GBP 2056 28.6 52.6 35.9 52.51.556%+RPI 50m IL bond GBP 2056 30.2 52.8 37.7 52.71.5865%+RPI 50m IL bond GBP 2056 30.3 53.1 37.9 53.01.591%+RPI 25m IL bond GBP 2056 15.1 26.5 18.9 26.41.662%+RPI 100m IL bond GBP 2056 62.7 106.2 78.0 106.01.815%+RPI 100m IL bond GBP 2056 66.5 106.4 82.4 106.21.847%+RPI 100m IL bond GBP 2056 67.5 106.8 83.4 106.71.5366%+RPI 50m IL bond GBP 2043 33.8 56.2 44.1 53.51.7937%+RPI 50m IL bond GBP 2049 37.1 56.1 46.4 53.41.585%+RPI 100m IL bond GBP 2057 60.5 102.2 75.7 102.01.702%+RPI 50m IL bond GBP 2057 31.7 51.5 39.6 51.41.66%+RPI 35m IL bond GBP 2037 24.3 35.4 30.1 35.41.97%+RPI 200m IL loan GBP 2016 183.7 220.2 194.1 209.01.61%+RPI 50m IL loan GBP 2020 42.3 48.5 – –1.73%+RPI 50m IL loan GBP 2020 42.9 48.4 – –1.84%+RPI 50m IL loan GBP 2020 43.7 48.4 – –1.88%+RPI 50m IL loan GBP 2020 43.5 48.2 – –1.90%+RPI 50m IL loan GBP 2020 43.7 48.3 – –1.93%+RPI 50m IL loan GBP 2020 43.8 48.2 – –2.10%+RPI 50m IL loan GBP 2020 44.6 48.1 – –2.46%+RPI 50m IL loan GBP 2020 46.4 48.2 – –6.125% 375m bond GBP 2015 405.9 379.1 – –0.24%+LIBOR (floating) 6.5m bond GBP 2013 6.5 6.3 6.5 6.44.21% 10m bond EUR 2008 – – 8.0 8.00.385%+LIBOR (floating) 10m bond USD 2008 – – 5.0 5.00.365%+LIBOR (floating) 10m bond USD <strong>2009</strong> 7.0 7.0 5.1 5.01.3%+LIBOR (floating) 5bn bond JPY 2017 38.8 35.3 – –Long-term bank borrowings – fixed GBP 2008 – – 5.1 5.0Long-term bank borrowings – floating GBP 2010-2012 250.3 250.0 200.0 200.0Commission for New Towns loan GBP 2053 45.1 30.8 48.6 31.0Other debt issued by joint ventures Various Various 230.1 230.1 216.3 216.3Euro-commercial paper Various <strong>2009</strong> 56.1 56.1 – –Committed facilities – drawn GBP <strong>2009</strong> 55.0 55.0 – –Short-term bank borrowings – fixed GBP <strong>2009</strong> 84.1 84.1 – –70 unitedutilities.com