XMIPP introductory demo
XMIPP introductory demo
XMIPP introductory demo

You also want an ePaper? Increase the reach of your titles
YUMPU automatically turns print PDFs into web optimized ePapers that Google loves.
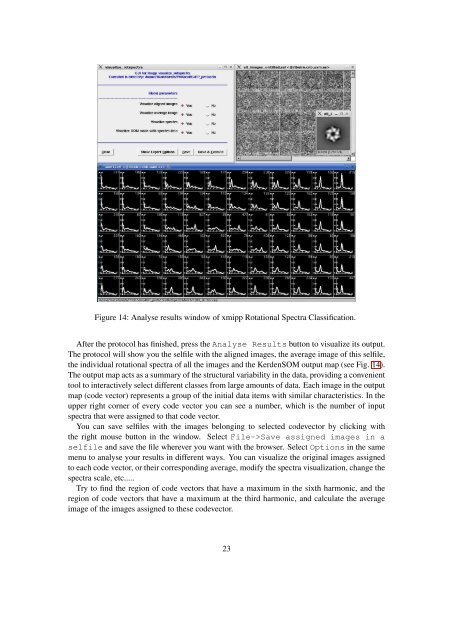
Figure 14: Analyse results window of xmipp Rotational Spectra Classification.After the protocol has finished, press the Analyse Results button to visualize its output.The protocol will show you the selfile with the aligned images, the average image of this selfile,the individual rotational spectra of all the images and the KerdenSOM output map (see Fig. 14).The output map acts as a summary of the structural variability in the data, providing a convenienttool to interactively select different classes from large amounts of data. Each image in the outputmap (code vector) represents a group of the initial data items with similar characteristics. In theupper right corner of every code vector you can see a number, which is the number of inputspectra that were assigned to that code vector.You can save selfiles with the images belonging to selected codevector by clicking withthe right mouse button in the window. Select File->Save assigned images in aselfile and save the file wherever you want with the browser. Select Options in the samemenu to analyse your results in different ways. You can visualize the original images assignedto each code vector, or their corresponding average, modify the spectra visualization, change thespectra scale, etc.....Try to find the region of code vectors that have a maximum in the sixth harmonic, and theregion of code vectors that have a maximum at the third harmonic, and calculate the averageimage of the images assigned to these codevector.23