- Page 1:
UNIVERSIDADE TÉCNICA DE LISBOAINST
- Page 6 and 7:
iior gave some support to the devel
- Page 9:
ResumoO comportamento humano tem si
- Page 12 and 13:
viii2.3.2 Voice . . . . . . . . . .
- Page 14 and 15:
x6.2.2 Feature Analysis . . . . . .
- Page 16 and 17:
xii4.2 The x-y representation of th
- Page 18 and 19:
xiv
- Page 20 and 21:
xvi
- Page 22 and 23:
xviiiFCT Fundação para a Ciência
- Page 25 and 26:
Chapter 1Introduction1.1 The Proble
- Page 27 and 28:
1.1. THE PROBLEM 3Figure 1.2: ECG s
- Page 29 and 30:
1.2. MOTIVATION 5authentication sit
- Page 31 and 32:
1.3. CONTRIBUTIONS 7resource in the
- Page 33 and 34:
1.4. THESIS STRUCTURE 9The present
- Page 35 and 36:
Chapter 2State of the ArtIn this ch
- Page 37 and 38:
2.1. BIOMETRICS CONCEPTS 13to class
- Page 39 and 40:
2.1. BIOMETRICS CONCEPTS 15by the s
- Page 41 and 42:
2.2. BIOMETRICS TECHNOLOGIES 17Figu
- Page 43 and 44:
2.3. BEHAVIORAL BIOMETRICS 19Septem
- Page 45 and 46:
2.3. BEHAVIORAL BIOMETRICS 21and co
- Page 47 and 48:
2.3. BEHAVIORAL BIOMETRICS 232. ove
- Page 49 and 50:
2.3. BEHAVIORAL BIOMETRICS 25Figure
- Page 51 and 52:
2.3. BEHAVIORAL BIOMETRICS 27situat
- Page 53 and 54:
2.3. BEHAVIORAL BIOMETRICS 29of sig
- Page 55 and 56:
2.4. MULTIMODAL BIOMETRICS 312.4 Mu
- Page 57 and 58:
2.6. DISCUSSION AND CONCLUSION 33al
- Page 59 and 60:
Chapter 3Information Sources - HCI
- Page 61 and 62: 3.2. HUMAN COMPUTER INTERACTION 37t
- Page 63 and 64: 3.2. HUMAN COMPUTER INTERACTION 39I
- Page 65 and 66: 3.2. HUMAN COMPUTER INTERACTION 41F
- Page 67 and 68: 3.3. PHYSIOLOGICAL SIGNALS 43Histor
- Page 69 and 70: 3.3. PHYSIOLOGICAL SIGNALS 45Figure
- Page 71 and 72: 3.3. PHYSIOLOGICAL SIGNALS 47Term D
- Page 73 and 74: 3.3. PHYSIOLOGICAL SIGNALS 49Figure
- Page 75 and 76: 3.4. MATERIALS AND METHODS 51Figure
- Page 77 and 78: 3.4. MATERIALS AND METHODS 53had th
- Page 79 and 80: 3.4. MATERIALS AND METHODS 55Figure
- Page 81 and 82: 3.4. MATERIALS AND METHODS 57Figure
- Page 83 and 84: 3.6. CONCLUSION 59set of computatio
- Page 85 and 86: Chapter 4Signal Processing andFeatu
- Page 87 and 88: 4.1. HUMAN-COMPUTER INTERACTION 63I
- Page 89 and 90: 4.1. HUMAN-COMPUTER INTERACTION 65T
- Page 91 and 92: 4.1. HUMAN-COMPUTER INTERACTION 674
- Page 93 and 94: 4.2. ELECTRODERMAL ACTIVITY 69To ex
- Page 95 and 96: 4.2. ELECTRODERMAL ACTIVITY 71(eq.
- Page 97 and 98: 4.2. ELECTRODERMAL ACTIVITY 73model
- Page 99 and 100: 4.2. ELECTRODERMAL ACTIVITY 75the p
- Page 101 and 102: 4.2. ELECTRODERMAL ACTIVITY 77t 3 =
- Page 103 and 104: 4.2. ELECTRODERMAL ACTIVITY 79The d
- Page 105 and 106: 4.2. ELECTRODERMAL ACTIVITY 81the e
- Page 107 and 108: 4.2. ELECTRODERMAL ACTIVITY 831.00.
- Page 109 and 110: 4.3. ELECTROCARDIOGRAM 8511.111.010
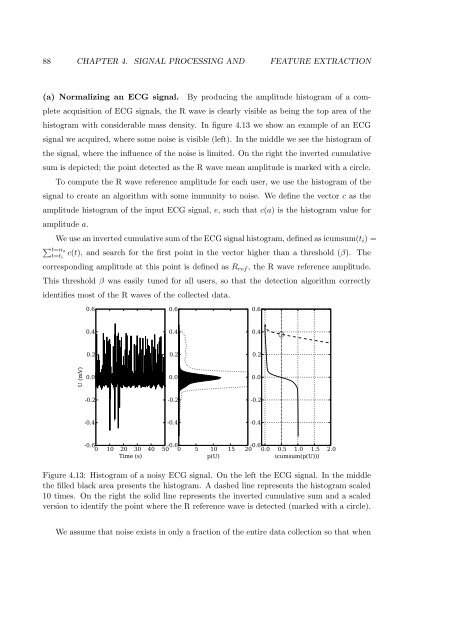
- Page 111: 4.3. ELECTROCARDIOGRAM 87to the car
- Page 115 and 116: 4.4. CONCLUSION 918. a T - The ampl
- Page 117 and 118: Chapter 5Feature Selection andClass
- Page 119 and 120: 5.1. STATISTICAL MODELING 95Weibull
- Page 121 and 122: 5.2. USER TUNED FEATURE SELECTION 9
- Page 123 and 124: 5.2. USER TUNED FEATURE SELECTION 9
- Page 125 and 126: 5.3. SEQUENTIAL CLASSIFICATION 101p
- Page 127 and 128: 5.3. SEQUENTIAL CLASSIFICATION 103s
- Page 129 and 130: 5.3. SEQUENTIAL CLASSIFICATION 105n
- Page 131 and 132: 5.4. UNCERTAINTY BASED CLASSIFICATI
- Page 133 and 134: 5.4. UNCERTAINTY BASED CLASSIFICATI
- Page 135 and 136: 5.4. UNCERTAINTY BASED CLASSIFICATI
- Page 137 and 138: 5.5. CONCLUSIONS 113of behavioral d
- Page 139 and 140: Chapter 6Applications and ResultsTh
- Page 141 and 142: 6.1. POINTER DYNAMICS BIOMETRICS 11
- Page 143 and 144: 6.1. POINTER DYNAMICS BIOMETRICS 11
- Page 145 and 146: 6.2. SYMPATHETIC DYNAMICS BIOMETRIC
- Page 147 and 148: 6.2. SYMPATHETIC DYNAMICS BIOMETRIC
- Page 149 and 150: 6.2. SYMPATHETIC DYNAMICS BIOMETRIC
- Page 151 and 152: 6.2. SYMPATHETIC DYNAMICS BIOMETRIC
- Page 153 and 154: 6.2. SYMPATHETIC DYNAMICS BIOMETRIC
- Page 155 and 156: 6.3. HEART DYNAMICS BIOMETRICS 1316
- Page 157 and 158: 6.3. HEART DYNAMICS BIOMETRICS 133F
- Page 159 and 160: 6.4. CONCLUSION 135time(s) EDA EER
- Page 161 and 162: Chapter 7ConclusionsIn this chapter
- Page 163 and 164:
7.2. APPLICATION SCENARIOS 139adequ
- Page 165 and 166:
7.3. FUTURE WORK 141the user clicks
- Page 167 and 168:
Appendix AToolsThe work underlying
- Page 169 and 170:
A.2. SCIENTIFIC COMPUTATION 145side
- Page 171 and 172:
Appendix BTestsThe set of tests dev
- Page 173 and 174:
B.1. INTELLIGENCE TEST 149Figure B.
- Page 175 and 176:
B.2. MEMORY TEST 151# 2 3 3# 2 3 3#
- Page 177 and 178:
B.2. MEMORY TEST 153Level. In this
- Page 179 and 180:
B.3. ASSOCIATION TEST 155Guide. Ini
- Page 181 and 182:
B.5. CONCENTRATION TEST 157Descript
- Page 183 and 184:
B.5. CONCENTRATION TEST 159Test Gen
- Page 185 and 186:
B.6. TEST’S SEQUENCE 161Orderpage
- Page 187 and 188:
B.7. RELATED DOCUMENTS 163Figure B.
- Page 189 and 190:
B.7. RELATED DOCUMENTS 165Figure B.
- Page 191 and 192:
B.7. RELATED DOCUMENTS 167Figure B.
- Page 193 and 194:
Bibliography[1] A. Acharya, M. Cutt
- Page 195 and 196:
BIBLIOGRAPHY 171[18] B. Bimbaum. US
- Page 197 and 198:
BIBLIOGRAPHY 173[42] H. D. Critchle
- Page 199 and 200:
BIBLIOGRAPHY 175[63] R. Fernandez a
- Page 201 and 202:
BIBLIOGRAPHY 177[84] H. Gamboa, A.
- Page 203 and 204:
BIBLIOGRAPHY 179[102] S. Hocquet, J
- Page 205 and 206:
BIBLIOGRAPHY 181[124] R. M. Kaplan
- Page 207 and 208:
BIBLIOGRAPHY 183[145] C. L. Lim, E.
- Page 209 and 210:
BIBLIOGRAPHY 185[169] NBSP. Interna
- Page 211 and 212:
BIBLIOGRAPHY 187[191] T. Pixley. Do
- Page 213 and 214:
BIBLIOGRAPHY 189[214] T. Shen and W
- Page 215 and 216:
BIBLIOGRAPHY 191[236] M. Trauring.