- Page 1:
IE-Commerce
- Page 4 and 5:
Published by In-TehIn-TehOlajnica 1
- Page 7 and 8:
VIIWe wish to thank the reviewers o
- Page 9:
IXContentsPrefaceV1. A Conceptual F
- Page 13 and 14:
A Conceptual Framework and an Exten
- Page 15 and 16:
A Conceptual Framework and an Exten
- Page 17 and 18:
A Conceptual Framework and an Exten
- Page 19:
A Conceptual Framework and an Exten
- Page 22 and 23:
12E-CommerceThe Application Layer c
- Page 24 and 25:
14E-CommerceService description. Th
- Page 26 and 27:
16E-Commerceunderstanding about the
- Page 28 and 29:
18E-CommerceThis chapter contribute
- Page 30 and 31:
20E-CommercePorter M (2001). Strate
- Page 32 and 33:
22E-CommerceTo evaluate the e-comme
- Page 34 and 35:
24E-CommerceAa 2a a4m1 m 2 m 3m (
- Page 36 and 37:
26E-CommerceV v ij , i 1,2,...,
- Page 38 and 39:
28E-CommerceIndexFuzzy numberAltern
- Page 40 and 41:
30E-CommerceS. Mabuchi (1988). An a
- Page 42 and 43:
32E-Commercetechnology implementati
- Page 44 and 45:
34E-Commerceapplied to study an ind
- Page 46 and 47:
36E-Commerce PEOU of the public sec
- Page 48 and 49:
38E-CommerceNITC (National Informat
- Page 50 and 51:
40E-Commercewill describe the mecha
- Page 52 and 53:
42E-Commerce(2) The manner of commu
- Page 54 and 55:
44E-CommerceIf ADS is employed in a
- Page 56 and 57:
46E-Commerce4.2 Case studyThe detai
- Page 58 and 59:
48E-CommerceAs a high-speed develop
- Page 60 and 61:
50E-Commerce4.3.2 The architecture
- Page 62 and 63:
52E-Commerceone conclusion is that
- Page 64 and 65:
54E-Commerce
- Page 66 and 67:
56E-Commerceorganizations expose de
- Page 68 and 69:
58E-Commercerules. Such adapters ne
- Page 70 and 71:
60E-CommerceThe third level of inve
- Page 72 and 73:
62E-Commercecommon “language” h
- Page 74 and 75:
64E-Commercewell described in (Mül
- Page 76 and 77:
66E-Commerce3.3 Organizational Comp
- Page 78 and 79:
68E-Commercethe interaction of defi
- Page 80 and 81:
70E-CommerceAs a first step towards
- Page 82 and 83: 72E-Commerce5. Conclusion and Outlo
- Page 84 and 85: 74E-CommerceSchmid, B. F., Schroth,
- Page 86 and 87: 76E-CommerceThe following section p
- Page 88 and 89: 78E-Commerce(a) G cooc(b) G overlap
- Page 90 and 91: 80E-CommerceBetweenness centrality
- Page 92 and 93: 82E-Commerce4.1.1 Generating Networ
- Page 94 and 95: 84E-CommerceThe resultant value som
- Page 96 and 97: 86E-CommerceG shareholdershareholdi
- Page 98 and 99: 88E-Commerce17: Murata Noda Screen
- Page 100 and 101: 90E-Commerceand testing data in the
- Page 102: 92E-Commerce(c) Centrality-based ra
- Page 105 and 106: Ranking Companies Based on Multiple
- Page 107 and 108: Ranking Companies Based on Multiple
- Page 109 and 110: Considering Culture in Designing We
- Page 111 and 112: Considering Culture in Designing We
- Page 113 and 114: Considering Culture in Designing We
- Page 115 and 116: Considering Culture in Designing We
- Page 117 and 118: Considering Culture in Designing We
- Page 119 and 120: Considering Culture in Designing We
- Page 121 and 122: Considering Culture in Designing We
- Page 123 and 124: Consumer Responses to Colors of E-C
- Page 125 and 126: Consumer Responses to Colors of E-C
- Page 127 and 128: Consumer Responses to Colors of E-C
- Page 130 and 131: 120E-Commerce4. Research methodOur
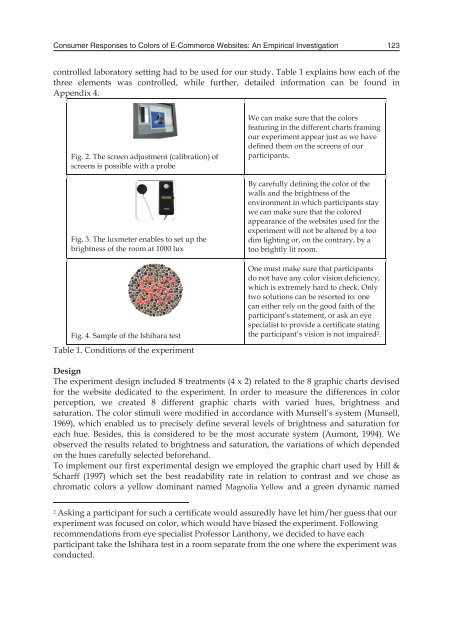
- Page 134 and 135: 124E-CommerceNewsvine Green. Starti
- Page 136 and 137: 126E-CommerceProcedureRespondents w
- Page 138 and 139: 128E-Commerce6. Data analysis and r
- Page 140 and 141: 130E-CommerceHue 1Newsvine Green (d
- Page 142 and 143: 132E-CommerceEffects of graphic cha
- Page 144 and 145: 134E-Commercethe consumer retains w
- Page 146 and 147: 136E-Commercemaintain, load more ra
- Page 148 and 149: 138E-CommerceBellizzi J. A. & Hite
- Page 150 and 151: 140E-CommerceHill A. & Scharff L. V
- Page 152 and 153: 142E-CommerceSpool J. M., Scanlon T
- Page 154 and 155: 144E-CommerceConsequently, we concl
- Page 156 and 157: 146E-CommerceDimensionsSystems qual
- Page 158 and 159: 148E-Commercefunction deployment (Q
- Page 160 and 161: 150E-CommerceUseful help serviceEle
- Page 162 and 163: 152E-Commerceplanning, enacting and
- Page 164 and 165: 154E-Commercecomplete and measurabl
- Page 166 and 167: 156E-Commerce There is "About us" s
- Page 168 and 169: 158E-Commerce Validation testing -
- Page 170 and 171: 160E-Commercefor the Websites (Lohs
- Page 172 and 173: 162E-CommerceSinnappan S., Carlson
- Page 174 and 175: 164E-Commercerecommendations of a t
- Page 176 and 177: 166E-Commerce3.1 Neighborhood Based
- Page 178 and 179: 168E-Commerce3.3 Significance Weigh
- Page 180 and 181: 170E-Commerce , u1 0,fR5fuR1 u2else
- Page 182 and 183:
172E-CommerceFigure 6 shows the ste
- Page 184 and 185:
174E-CommerceMAE0.750.740.730.720.7
- Page 187 and 188:
Improving performance in recommende
- Page 189 and 190:
Improving performance in recommende
- Page 191 and 192:
Improving performance in recommende
- Page 193 and 194:
Attacks on Two Buyer-Seller Waterma
- Page 195 and 196:
Attacks on Two Buyer-Seller Waterma
- Page 197 and 198:
Attacks on Two Buyer-Seller Waterma
- Page 199 and 200:
Attacks on Two Buyer-Seller Waterma
- Page 201 and 202:
Attacks on Two Buyer-Seller Waterma
- Page 203 and 204:
Attacks on Two Buyer-Seller Waterma
- Page 205 and 206:
Attacks on Two Buyer-Seller Waterma
- Page 207 and 208:
Attacks on Two Buyer-Seller Waterma
- Page 209 and 210:
Attacks on Two Buyer-Seller Waterma
- Page 211 and 212:
Attacks on Two Buyer-Seller Waterma
- Page 213 and 214:
Electronic Commerce Readinessin Dev
- Page 215 and 216:
Electronic Commerce Readinessin Dev
- Page 217 and 218:
Electronic Commerce Readinessin Dev
- Page 219 and 220:
Electronic Commerce Readinessin Dev
- Page 221 and 222:
Electronic Commerce Readinessin Dev
- Page 223 and 224:
Electronic Commerce Readinessin Dev
- Page 225 and 226:
Electronic Commerce Readinessin Dev
- Page 227 and 228:
Electronic Commerce Readinessin Dev
- Page 229 and 230:
Electronic Commerce Readinessin Dev
- Page 231 and 232:
Electronic Commerce Readinessin Dev
- Page 233 and 234:
Electronic Commerce Readinessin Dev
- Page 235 and 236:
Electronic Commerce Readinessin Dev
- Page 237 and 238:
Electronic Commerce Readinessin Dev
- Page 239 and 240:
Can a Recommender System induce ser
- Page 241 and 242:
Can a Recommender System induce ser
- Page 243 and 244:
Can a Recommender System induce ser
- Page 245 and 246:
Can a Recommender System induce ser
- Page 247 and 248:
Can a Recommender System induce ser
- Page 249 and 250:
Can a Recommender System induce ser
- Page 251 and 252:
Can a Recommender System induce ser
- Page 253 and 254:
Can a Recommender System induce ser
- Page 255 and 256:
Can a Recommender System induce ser
- Page 257 and 258:
A Mobile Commerce Model for Automob
- Page 259 and 260:
A Mobile Commerce Model for Automob
- Page 261 and 262:
A Mobile Commerce Model for Automob
- Page 263 and 264:
A Mobile Commerce Model for Automob
- Page 265 and 266:
A Mobile Commerce Model for Automob
- Page 267 and 268:
A Mobile Commerce Model for Automob
- Page 269 and 270:
A Mobile Commerce Model for Automob
- Page 271 and 272:
A Mobile Commerce Model for Automob
- Page 273 and 274:
A Mobile Commerce Model for Automob
- Page 275 and 276:
A Mobile Commerce Model for Automob
- Page 277 and 278:
The Automatic Attaching Function Ba
- Page 279 and 280:
The Automatic Attaching Function Ba
- Page 281 and 282:
The Automatic Attaching Function Ba
- Page 283 and 284:
The Automatic Attaching Function Ba
- Page 285 and 286:
The Automatic Attaching Function Ba
- Page 287 and 288:
The Automatic Attaching Function Ba
- Page 289 and 290:
The Automatic Attaching Function Ba
- Page 291 and 292:
The Automatic Attaching Function Ba
- Page 293 and 294:
The Automatic Attaching Function Ba












![focuspdca.ppt [Compatibility Mode]](https://img.yumpu.com/22859457/1/190x146/focuspdcappt-compatibility-mode.jpg?quality=85)

