Education Annual Report 2002-2003 - Gauteng Online
Education Annual Report 2002-2003 - Gauteng Online
Education Annual Report 2002-2003 - Gauteng Online

You also want an ePaper? Increase the reach of your titles
YUMPU automatically turns print PDFs into web optimized ePapers that Google loves.
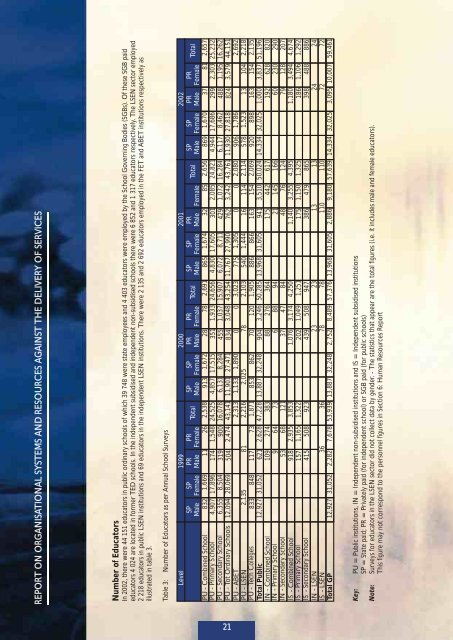
REPORT ON ORGANISATIONAL SYSTEMS AND RESOURCES AGAINST THE DELIVERY OF SERVICESNumber of EducatorsIn <strong>2002</strong>, there were 44 151 educators in public ordinary schools of which 39 748 were state employees and 4 403 educators were employed by the School Governing Bodies (SGBs). Of these SGB paideducators 4 024 are located in former TED schools. In the independent subsidised and independent non-subsidised schools there were 6 852 and 1 317 educators respectively. The LSEN sector employed2 218 educators in public LSEN institutions and 69 educators in the independent LSEN institutions. There were 2 135 and 2 692 educators employed in the FET and ABET institutions respectively asillustrated in table 3.Table 3: Number of Educators as per <strong>Annual</strong> School SurveysLevelPU - Combined SchoolPU - Primary SchoolPU - Secondary SchoolPU - Tot Ordinary SchoolsPU - ABETPU - LSENPU - Tech CollegesTotal PublicIN - Combined SchoolIN - Primary SchoolIN - Secondary SchoolIS - Combined SchoolIS - Primary SchoolIS - Secondary SchoolIN - LSENIS - LSENSPMale8324,9076,35512,094SPFemale1,66917,8968,50428,0692,135833 84812,927 31,0521999PRMale1117431950481117621109953918157415362,282PRFemale261,5489002,474732,62827464682,9351,165508Total2,53824,52516,07843,1412,3132,2161,87147,228383731213,8531,3229233653,939SPMale9134,8576,13111,9011,1332,02585313,887SPFemale1,67217,5158,28427,4711,890Total GP 12,927 31,052 7,678 13,887 32,248 8,489 13,968 31,60586232,2482000PRMale2835145583407870904886371,07620243923782,752PRFemale781,9331,0373,04801203,24627688473,1741,049508Total2,69124,65615,90743,2543,0232,1031,90550,28536494844,2501,251947237857,376SPMale8654,8306,07211,76777554088613,968SPFemale1,67417,6058,71127,9901,3051,44486631,6052001PRMale3230142976201616394117521481,140175386131102,886PRFemale852,0851,0723,24201141543,510442145763,2551,1504799,180Total2,65624,82116,28443,7612,0802,1142,06950,0246171661244,3951,3258651311057,639SPMale8694,9446,11711,93090657892014,33414,334SPFemale1,67017,6868,46227,8181,7861,52389832,02532,025<strong>2002</strong>PRMale37299488824131631,00019260791,18018639824723,095PRFemale812,3031,1953,5791041543,8376282301283,4941,10648810,007Total2,65725,23216,26244,1512,6922,2182,13551,1968202902074,6741,292886247259,461Key: PU = Public institutions, IN = Independent non-subsidised institutions and IS = Independent subsidised institutionsSP = State paid; PR = Privately paid (for independent school) or SGB paid (for public schools)Note: Surveys for educators in the LSEN sector did not collect data by gender. - The statistics that appear are the total figures (i.e. it includes male and female educators).This figure may not correspond to the personnel figures in Section 6: Human Resources <strong>Report</strong>21