Education Annual Report 2002-2003 - Gauteng Online
Education Annual Report 2002-2003 - Gauteng Online
Education Annual Report 2002-2003 - Gauteng Online
You also want an ePaper? Increase the reach of your titles
YUMPU automatically turns print PDFs into web optimized ePapers that Google loves.
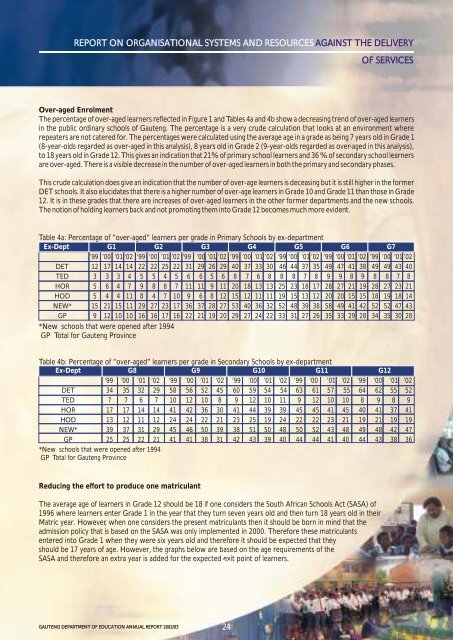
REPORT ON ORGANISATIONAL SYSTEMS AND RESOURCES AGAINST THE DELIVERYOF SERVICESOver-aged EnrolmentThe percentage of over-aged learners reflected in Figure 1 and Tables 4a and 4b show a decreasing trend of over-aged learnersin the public ordinary schools of <strong>Gauteng</strong>. The percentage is a very crude calculation that looks at an environment whererepeaters are not catered for. The percentages were calculated using the average age in a grade as being 7 years old in Grade 1(8-year-olds regarded as over-aged in this analysis), 8 years old in Grade 2 (9-year-olds regarded as over-aged in this analysis),to 18 years old in Grade 12. This gives an indication that 21% of primary school learners and 36 % of secondary school learnersare over-aged. There is a visible decrease in the number of over-aged learners in both the primary and secondary phases.This crude calculation does give an indication that the number of over-age learners is deceasing but it is still higher in the formerDET schools. It also elucidates that there is a higher number of over-age learners in Grade 10 and Grade 11 than those in Grade12. It is in these grades that there are increases of over-aged learners in the other former departments and the new schools.The notion of holding learners back and not promoting them into Grade 12 becomes much more evident.Table 4a: Percentage of “over-aged” learners per grade in Primary Schools by ex-departmentEx-Dept G1 G2 G3 G4 G5 G6 G7’99 ’00 ’01 ’02 ’99 ’00 ’01 ’02 ’99 ’00 ’01 ’02 ’99 ’00 ’01 ’02 ’99 ’00 ’01 ’02 ’99 ’00 ’01 ’02 ’99 ’00 ’01 ’02DET 12 17 14 14 22 22 25 22 31 29 26 29 40 37 33 30 46 44 37 35 49 47 41 38 49 49 43 40TED 3 3 3 4 5 5 4 5 6 6 5 6 8 7 6 8 8 8 7 8 9 9 8 9 8 8 7 8HOR 5 6 4 7 9 8 8 7 11 11 9 11 20 18 13 13 25 23 18 17 28 27 21 19 28 27 23 21HOD 5 4 4 11 8 4 7 10 9 6 8 12 15 12 11 11 19 15 13 12 20 20 15 15 18 19 18 14NEW* 15 21 15 11 29 27 23 17 36 37 28 27 53 40 36 32 52 48 39 38 58 49 41 42 52 52 47 43GP 9 12 10 10 16 16 17 16 22 21 19 20 29 27 24 22 33 31 27 26 35 33 29 28 34 35 30 28*New schools that were opened after 1994GP Total for <strong>Gauteng</strong> ProvinceTable 4b: Percentage of “over-aged” learners per grade in Secondary Schools by ex-departmentEx-Dept G8 G9 G10 G11 G12’99 ’00 ’01 ’02 ’99 ’00 ’01 ’02 ’99 ’00 ’01 ’02 ’99 ’00 ’01 ’02 ’99 ’00 ’01 ’02DET 34 35 32 29 58 56 52 45 60 59 54 54 63 61 57 55 64 62 55 52TED 7 7 6 7 10 12 10 8 9 12 10 11 9 12 10 10 8 9 8 9HOR 17 17 14 14 41 42 36 30 41 44 39 39 45 45 41 45 40 41 37 41HOD 13 12 11 12 24 24 22 21 23 25 19 24 22 22 23 21 19 21 19 19NEW* 39 37 31 29 45 46 50 39 38 51 50 48 50 52 43 48 49 48 42 47GP 25 25 22 21 41 41 38 31 42 43 39 40 44 44 41 40 44 43 38 36*New schools that were opened after 1994GP Total for <strong>Gauteng</strong> ProvinceReducing the effort to produce one matriculantThe average age of learners in Grade 12 should be 18 if one considers the South African Schools Act (SASA) of1996 where learners enter Grade 1 in the year that they turn seven years old and then turn 18 years old in theirMatric year. However, when one considers the present matriculants then it should be born in mind that theadmission policy that is based on the SASA was only implemented in 2000. Therefore these matriculantsentered into Grade 1 when they were six years old and therefore it should be expected that theyshould be 17 years of age. However, the graphs below are based on the age requirements of theSASA and therefore an extra year is added for the expected exit point of learners.24GAUTENG DEPARTMENT OF EDUCATION ANNUAL REPORT <strong>2002</strong>/0324


