

Revenues & EXPENSES
2015 Division I RE report
2015 Division I RE report
- No tags were found...

You also want an ePaper? Increase the reach of your titles
YUMPU automatically turns print PDFs into web optimized ePapers that Google loves.
Division I – FBS<br />
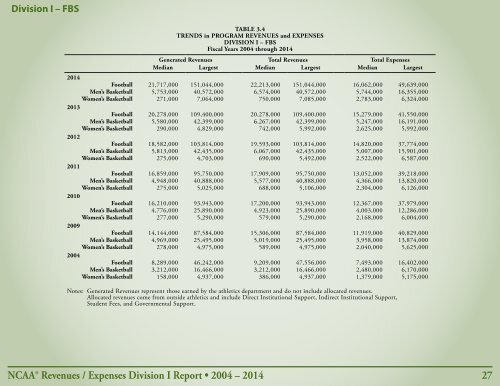
TABLE 3.4<br />
TRENDS in PROGRAM REVENUES and <strong>EXPENSES</strong><br />
DIVISION I – FBS<br />
Fiscal Years 2004 through 2014<br />
Generated <strong>Revenues</strong> Total <strong>Revenues</strong> Total Expenses<br />
Median Largest Median Largest Median Largest<br />
2014<br />
Football 21,717,000 151,044,000 22,213,000 151,044,000 16,062,000 49,639,000<br />
Men’s Basketball 5,753,000 40,572,000 6,574,000 40,572,000 5,744,000 16,355,000<br />
Women’s Basketball 271,000 7,064,000 750,000 7,085,000 2,783,000 6,324,000<br />
2013<br />
Football 20,278,000 109,400,000 20,278,000 109,400,000 15,279,000 41,550,000<br />
Men’s Basketball 5,580,000 42,399,000 6,267,000 42,399,000 5,247,000 16,191,000<br />
Women’s Basketball 290,000 4,829,000 742,000 5,992,000 2,625,000 5,992,000<br />
2012<br />
Football 18,582,000 103,814,000 19,593,000 103,814,000 14,820,000 37,774,000<br />
Men’s Basketball 5,813,000 42,435,000 6,067,000 42,435,000 5,007,000 15,901,000<br />
Women’s Basketball 275,000 4,703,000 690,000 5,492,000 2,522,000 6,587,000<br />
2011<br />
Football 16,859,000 95,750,000 17,909,000 95,750,000 13,052,000 39,218,000<br />
Men’s Basketball 4,948,000 40,888,000 5,577,000 40,888,000 4,366,000 13,820,000<br />
Women’s Basketball 275,000 5,025,000 688,000 5,106,000 2,304,000 6,126,000<br />
2010<br />
Football 16,210,000 93,943,000 17,200,000 93,943,000 12,367,000 37,979,000<br />
Men’s Basketball 4,776,000 25,890,000 4,923,000 25,890,000 4,003,000 12,286,000<br />
Women’s Basketball 277,000 5,290,000 579,000 5,290,000 2,168,000 6,004,000<br />
2009<br />
Football 14,144,000 87,584,000 15,306,000 87,584,000 11,919,000 40,829,000<br />
Men’s Basketball 4,969,000 25,495,000 5,019,000 25,495,000 3,958,000 13,874,000<br />
Women’s Basketball 278,000 4,975,000 589,000 4,975,000 2,040,000 5,625,000<br />
2004<br />
Football 8,289,000 46,242,000 9,209,000 47,556,000 7,493,000 16,402,000<br />
Men’s Basketball 3,212,000 16,466,000 3,212,000 16,466,000 2,480,000 6,170,000<br />
Women’s Basketball 158,000 4,937,000 386,000 4,937,000 1,379,000 5,175,000<br />
Notes: Generated <strong>Revenues</strong> represent those earned by the athletics department and do not include allocated revenues.<br />
Allocated revenues come from outside athletics and include Direct Institutional Support, Indirect Institutional Support,<br />
Student Fees, and Governmental Support.<br />
NCAA® <strong>Revenues</strong> / Expenses Division I Report • 2004 – 2014 27