

Revenues & EXPENSES
2015 Division I RE report
2015 Division I RE report
- No tags were found...

Create successful ePaper yourself
Turn your PDF publications into a flip-book with our unique Google optimized e-Paper software.
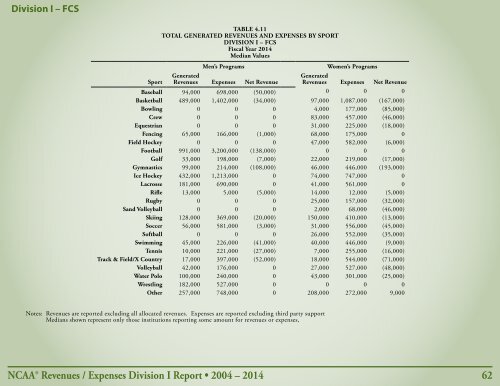
Division I – FCS<br />
TABLE 4.11<br />
TOTAL GENERATED REVENUES AND <strong>EXPENSES</strong> BY SPORT<br />
DIVISION I – FCS<br />
Fiscal Year 2014<br />
Median Values<br />
Sport<br />
Men’s Programs<br />
Generated<br />
<strong>Revenues</strong> Expenses Net Revenue<br />
Women’s Programs<br />
Generated<br />
<strong>Revenues</strong> Expenses Net Revenue<br />
Baseball 94,000 698,000 (50,000) 0 0 0<br />
Basketball 489,000 1,402,000 (34,000) 97,000 1,087,000 (167,000)<br />
Bowling 0 0 0 4,000 177,000 (85,000)<br />
Crew 0 0 0 83,000 457,000 (46,000)<br />
Equestrian 0 0 0 31,000 225,000 (18,000)<br />
Fencing 65,000 166,000 (1,000) 68,000 175,000 0<br />
Field Hockey 0 0 0 47,000 582,000 (6,000)<br />
Football 991,000 3,200,000 (138,000) 0 0 0<br />
Golf 33,000 198,000 (7,000) 22,000 219,000 (17,000)<br />
Gymnastics 99,000 214,000 (108,000) 46,000 446,000 (193,000)<br />
Ice Hockey 432,000 1,213,000 0 74,000 747,000 0<br />
Lacrosse 181,000 690,000 0 41,000 561,000 0<br />
Rifle 13,000 5,000 (5,000) 14,000 12,000 (5,000)<br />
Rugby 0 0 0 25,000 157,000 (32,000)<br />
Sand Volleyball 0 0 0 2,000 68,000 (46,000)<br />
Skiing 128,000 369,000 (20,000) 150,000 410,000 (13,000)<br />
Soccer 56,000 581,000 (3,000) 31,000 556,000 (45,000)<br />
Softball 0 0 0 26,000 552,000 (35,000)<br />
Swimming 45,000 226,000 (41,000) 40,000 446,000 (9,000)<br />
Tennis 10,000 221,000 (27,000) 7,000 255,000 (16,000)<br />
Track & Field/X Country 17,000 397,000 (52,000) 18,000 544,000 (71,000)<br />
Volleyball 42,000 176,000 0 27,000 527,000 (48,000)<br />
Water Polo 100,000 240,000 0 43,000 301,000 (25,000)<br />
Wrestling 182,000 527,000 0 0 0 0<br />
Other 257,000 748,000 0 208,000 272,000 9,000<br />
Notes: <strong>Revenues</strong> are reported excluding all allocated revenues. Expenses are reported excluding third party support<br />
Medians shown represent only those institutions reporting some amount for revenues or expenses,<br />
NCAA® <strong>Revenues</strong> / Expenses Division I Report • 2004 – 2014 62