

Revenues & EXPENSES
2015 Division I RE report
2015 Division I RE report
- No tags were found...

You also want an ePaper? Increase the reach of your titles
YUMPU automatically turns print PDFs into web optimized ePapers that Google loves.
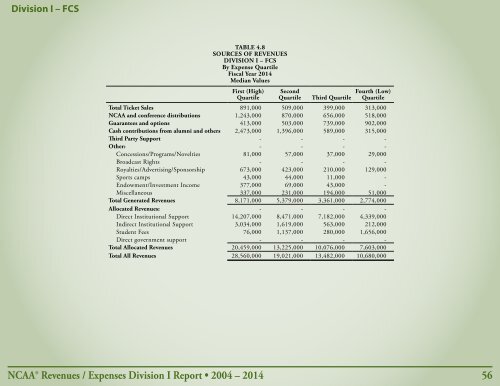
Division I – FCS<br />
TABLE 4.8<br />
SOURCES OF REVENUES<br />
DIVISION I – FCS<br />
By Expense Quartile<br />
Fiscal Year 2014<br />
Median Values<br />
First (High)<br />
Quartile<br />
Second<br />
Quartile<br />
Third Quartile<br />
Fourth (Low)<br />
Quartile<br />
Total Ticket Sales 891,000 509,000 399,000 313,000<br />
NCAA and conference distributions 1,243,000 870,000 656,000 518,000<br />
Guarantees and options 413,000 503,000 739,000 902,000<br />
Cash contributions from alumni and others 2,473,000 1,396,000 589,000 315,000<br />
Third Party Support - - - -<br />
Other: - - - -<br />
Concessions/Programs/Novelties 81,000 57,000 37,000 29,000<br />
Broadcast Rights - - - -<br />
Royalties/Advertising/Sponsorship 673,000 423,000 210,000 129,000<br />
Sports camps 43,000 44,000 11,000 -<br />
Endowment/Investment Income 377,000 69,000 43,000 -<br />
Miscellaneous 337,000 231,000 194,000 51,000<br />
Total Generated <strong>Revenues</strong> 8,171,000 5,379,000 3,361,000 2,774,000<br />
Allocated <strong>Revenues</strong>: - - - -<br />
Direct Institutional Support 14,207,000 8,471,000 7,182,000 4,339,000<br />
Indirect Institutional Support 3,034,000 1,619,000 563,000 212,000<br />
Student Fees 76,000 1,137,000 280,000 1,656,000<br />
Direct government support - - - -<br />
Total Allocated <strong>Revenues</strong> 20,459,000 13,225,000 10,076,000 7,603,000<br />
Total All <strong>Revenues</strong> 28,560,000 19,021,000 13,482,000 10,680,000<br />
NCAA® <strong>Revenues</strong> / Expenses Division I Report • 2004 – 2014 56