

Revenues & EXPENSES
2015 Division I RE report
2015 Division I RE report
- No tags were found...

You also want an ePaper? Increase the reach of your titles
YUMPU automatically turns print PDFs into web optimized ePapers that Google loves.
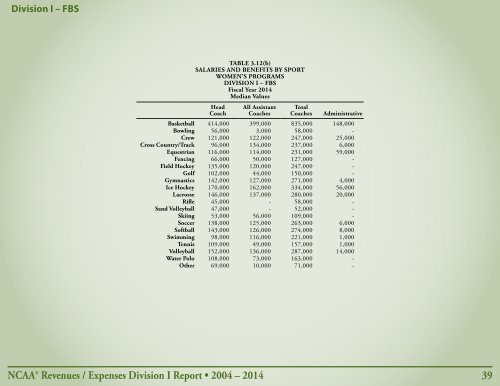
Division I – FBS<br />
TABLE 3.12(b)<br />
SALARIES AND BENEFITS BY SPORT<br />
WOMEN’S PROGRAMS<br />
DIVISION I – FBS<br />
Fiscal Year 2014<br />
Median Values<br />
Head<br />
Coach<br />
All Assistant<br />
Coaches<br />
Total<br />
Coaches<br />
Administrative<br />
Basketball 414,000 399,000 835,000 148,000<br />
Bowling 56,000 3,000 58,000 -<br />
Crew 121,000 122,000 247,000 25,000<br />
Cross Country/Track 96,000 134,000 237,000 6,000<br />
Equestrian 116,000 114,000 231,000 59,000<br />
Fencing 66,000 50,000 127,000 -<br />
Field Hockey 135,000 120,000 247,000 -<br />
Golf 102,000 44,000 150,000 -<br />
Gymnastics 142,000 127,000 271,000 4,000<br />
Ice Hockey 170,000 162,000 334,000 56,000<br />
Lacrosse 146,000 137,000 280,000 20,000<br />
Rifle 45,000 - 58,000 -<br />
Sand Volleyball 47,000 - 52,000 -<br />
Skiing 53,000 56,000 109,000 -<br />
Soccer 138,000 125,000 263,000 6,000<br />
Softball 143,000 126,000 274,000 8,000<br />
Swimming 98,000 116,000 221,000 1,000<br />
Tennis 109,000 49,000 157,000 1,000<br />
Volleyball 152,000 136,000 287,000 14,000<br />
Water Polo 108,000 73,000 163,000 -<br />
Other 69,000 10,000 71,000 -<br />
NCAA® <strong>Revenues</strong> / Expenses Division I Report • 2004 – 2014 39