

Revenues & EXPENSES
2015 Division I RE report
2015 Division I RE report
- No tags were found...

You also want an ePaper? Increase the reach of your titles
YUMPU automatically turns print PDFs into web optimized ePapers that Google loves.
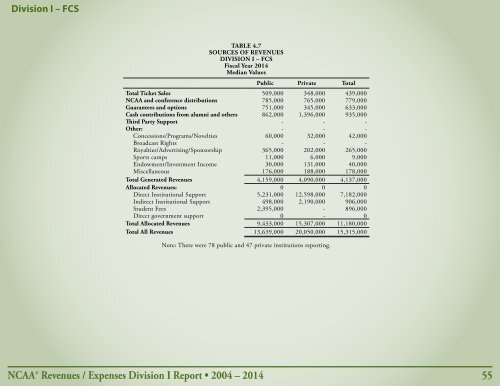
Division I – FCS<br />
TABLE 4.7<br />
SOURCES OF REVENUES<br />
DIVISION I – FCS<br />
Fiscal Year 2014<br />
Median Values<br />
Public Private Total<br />
Total Ticket Sales 509,000 348,000 439,000<br />
NCAA and conference distributions 785,000 765,000 779,000<br />
Guarantees and options 751,000 345,000 633,000<br />
Cash contributions from alumni and others 862,000 1,396,000 935,000<br />
Third Party Support - - -<br />
Other: - - -<br />
Concessions/Programs/Novelties 60,000 32,000 42,000<br />
Broadcast Rights - - -<br />
Royalties/Advertising/Sponsorship 365,000 202,000 265,000<br />
Sports camps 11,000 6,000 9,000<br />
Endowment/Investment Income 30,000 131,000 40,000<br />
Miscellaneous 176,000 188,000 178,000<br />
Total Generated <strong>Revenues</strong> 4,159,000 4,090,000 4,137,000<br />
Allocated <strong>Revenues</strong>: 0 0 0<br />
Direct Institutional Support 5,231,000 12,598,000 7,182,000<br />
Indirect Institutional Support 498,000 2,190,000 906,000<br />
Student Fees 2,395,000 - 896,000<br />
Direct government support 0 - 0<br />
Total Allocated <strong>Revenues</strong> 9,433,000 15,307,000 11,180,000<br />
Total All <strong>Revenues</strong> 13,639,000 20,050,000 15,315,000<br />
Note: There were 78 public and 47 private institutions reporting.<br />
NCAA® <strong>Revenues</strong> / Expenses Division I Report • 2004 – 2014 55