

Revenues & EXPENSES
2015 Division I RE report
2015 Division I RE report
- No tags were found...

You also want an ePaper? Increase the reach of your titles
YUMPU automatically turns print PDFs into web optimized ePapers that Google loves.
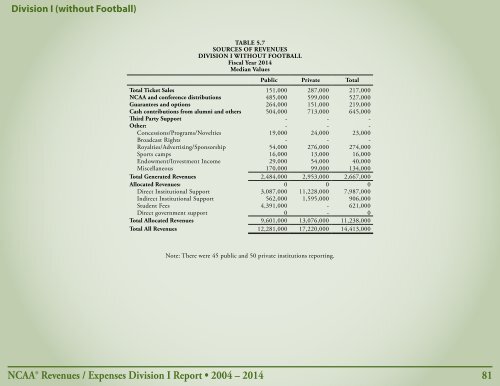
Division I (without Football)<br />
TABLE 5.7<br />
SOURCES OF REVENUES<br />
DIVISION I WITHOUT FOOTBALL<br />
Fiscal Year 2014<br />
Median Values<br />
Public Private Total<br />
Total Ticket Sales 151,000 287,000 217,000<br />
NCAA and conference distributions 485,000 599,000 527,000<br />
Guarantees and options 264,000 151,000 219,000<br />
Cash contributions from alumni and others 504,000 713,000 645,000<br />
Third Party Support - - -<br />
Other: - - -<br />
Concessions/Programs/Novelties 19,000 24,000 23,000<br />
Broadcast Rights - - -<br />
Royalties/Advertising/Sponsorship 54,000 276,000 274,000<br />
Sports camps 16,000 13,000 16,000<br />
Endowment/Investment Income 29,000 54,000 40,000<br />
Miscellaneous 170,000 99,000 134,000<br />
Total Generated <strong>Revenues</strong> 2,484,000 2,953,000 2,667,000<br />
Allocated <strong>Revenues</strong>: 0 0 0<br />
Direct Institutional Support 3,087,000 11,228,000 7,987,000<br />
Indirect Institutional Support 562,000 1,595,000 906,000<br />
Student Fees 4,391,000 - 621,000<br />
Direct government support 0 - 0<br />
Total Allocated <strong>Revenues</strong> 9,601,000 13,076,000 11,238,000<br />
Total All <strong>Revenues</strong> 12,281,000 17,220,000 14,413,000<br />
Note: There were 45 public and 50 private institutions reporting.<br />
NCAA® <strong>Revenues</strong> / Expenses Division I Report • 2004 – 2014 81