

Revenues & EXPENSES
2015 Division I RE report
2015 Division I RE report
- No tags were found...

Create successful ePaper yourself
Turn your PDF publications into a flip-book with our unique Google optimized e-Paper software.
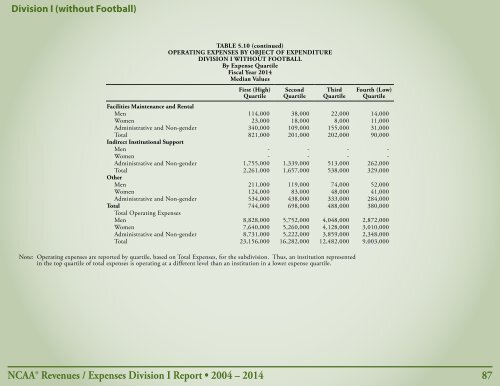
Division I (without Football)<br />
TABLE 5.10 (continued)<br />
OPERATING <strong>EXPENSES</strong> BY OBJECT OF EXPENDITURE<br />
DIVISION I WITHOUT FOOTBALL<br />
By Expense Quartile<br />
Fiscal Year 2014<br />
Median Values<br />
First (High)<br />
Quartile<br />
Second<br />
Quartile<br />
Third<br />
Quartile<br />
Facilities Maintenance and Rental<br />
Men 114,000 38,000 22,000 14,000<br />
Women 23,000 18,000 8,000 11,000<br />
Administrative and Non-gender 340,000 109,000 155,000 31,000<br />
Total 821,000 201,000 202,000 90,000<br />
Indirect Institutional Support<br />
Men - - - -<br />
Women - - - -<br />
Administrative and Non-gender 1,755,000 1,339,000 513,000 262,000<br />
Total 2,261,000 1,657,000 538,000 329,000<br />
Other<br />
Men 211,000 119,000 74,000 52,000<br />
Women 124,000 83,000 48,000 41,000<br />
Administrative and Non-gender 534,000 438,000 333,000 284,000<br />
Total 744,000 698,000 488,000 380,000<br />
Total Operating Expenses<br />
Men 8,828,000 5,752,000 4,048,000 2,872,000<br />
Women 7,640,000 5,260,000 4,128,000 3,010,000<br />
Administrative and Non-gender 8,731,000 5,222,000 3,859,000 2,348,000<br />
Total 23,156,000 16,282,000 12,482,000 9,003,000<br />
Note: Operating expenses are reported by quartile, based on Total Expenses, for the subdivision. Thus, an institution represented<br />
in the top quartile of total expenses is operating at a different level than an institution in a lower expense quartile.<br />
Fourth (Low)<br />
Quartile<br />
NCAA® <strong>Revenues</strong> / Expenses Division I Report • 2004 – 2014 87