

Measurements
Electron Spin Resonance and Transient Photocurrent ... - JuSER
Electron Spin Resonance and Transient Photocurrent ... - JuSER
- No tags were found...

Create successful ePaper yourself
Turn your PDF publications into a flip-book with our unique Google optimized e-Paper software.
Chapter 7: Transient Photocurrent <strong>Measurements</strong><br />
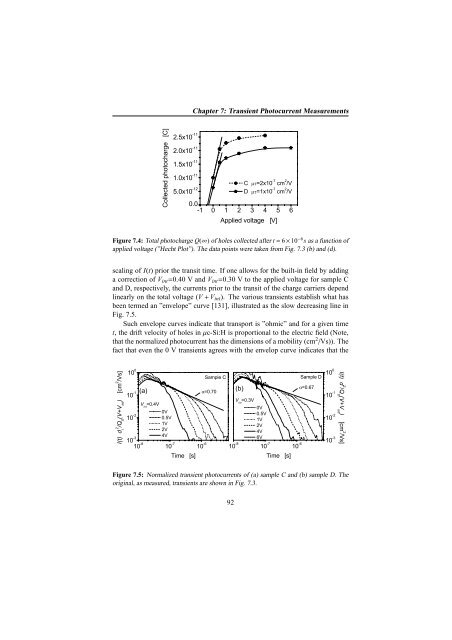
Figure 7.4: Total photocharge Q(∞) of holes collected after t = 6×10 −6 s as a function of<br />
applied voltage (”Hecht Plot”). The data points were taken from Fig. 7.3 (b) and (d).<br />
scaling of I(t) prior the transit time. If one allows for the built-in field by adding<br />
a correction of V int =0.40 V and V int =0.30 V to the applied voltage for sample C<br />
and D, respectively, the currents prior to the transit of the charge carriers depend<br />
linearly on the total voltage (V + V int ). The various transients establish what has<br />
been termed an ”envelope” curve [131], illustrated as the slow decreasing line in<br />
Fig. 7.5.<br />
Such envelope curves indicate that transport is ”ohmic” and for a given time<br />
t, the drift velocity of holes in µc-Si:H is proportional to the electric field (Note,<br />
that the normalized photocurrent has the dimensions of a mobility (cm 2 /Vs)). The<br />
fact that even the 0 V transients agrees with the envelop curve indicates that the<br />
α<br />
α<br />
Figure 7.5: Normalized transient photocurrents of (a) sample C and (b) sample D. The<br />
original, as measured, transients are shown in Fig. 7.3.<br />
92


