

Measurements
Electron Spin Resonance and Transient Photocurrent ... - JuSER
Electron Spin Resonance and Transient Photocurrent ... - JuSER
- No tags were found...

You also want an ePaper? Increase the reach of your titles
YUMPU automatically turns print PDFs into web optimized ePapers that Google loves.
5.4 Dangling Bond Density<br />
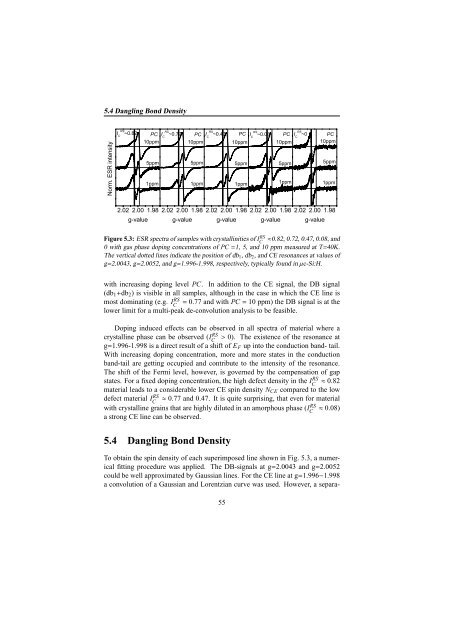
Figure 5.3: ESR spectra of samples with crystallinities of IC<br />
RS ≈0.82, 0.72, 0.47, 0.08, and<br />
0 with gas phase doping concentrations of PC =1, 5, and 10 ppm measured at T=40K.<br />
The vertical dotted lines indicate the position of db 1 ,db 2 , and CE resonances at values of<br />
g=2.0043, g=2.0052, and g=1.996-1.998, respectively, typically found in µc-Si:H.<br />
with increasing doping level PC. In addition to the CE signal, the DB signal<br />
(db 1 +db 2 ) is visible in all samples, although in the case in which the CE line is<br />
most dominating (e.g. IC<br />
RS = 0.77 and with PC = 10 ppm) the DB signal is at the<br />
lower limit for a multi-peak de-convolution analysis to be feasible.<br />
Doping induced effects can be observed in all spectra of material where a<br />
crystalline phase can be observed (IC<br />
RS > 0). The existence of the resonance at<br />
g=1.996-1.998 is a direct result of a shift of E F up into the conduction band- tail.<br />
With increasing doping concentration, more and more states in the conduction<br />
band-tail are getting occupied and contribute to the intensity of the resonance.<br />
The shift of the Fermi level, however, is governed by the compensation of gap<br />
states. For a fixed doping concentration, the high defect density in the IC RS ≈ 0.82<br />
material leads to a considerable lower CE spin density N CE compared to the low<br />
defect material IC<br />
RS ≈ 0.77 and 0.47. It is quite surprising, that even for material<br />
with crystalline grains that are highly diluted in an amorphous phase (IC RS ≈ 0.08)<br />
a strong CE line can be observed.<br />
5.4 Dangling Bond Density<br />
To obtain the spin density of each superimposed line shown in Fig. 5.3, a numerical<br />
fitting procedure was applied. The DB-signals at g=2.0043 and g=2.0052<br />
could be well approximated by Gaussian lines. For the CE line at g=1.996−1.998<br />
a convolution of a Gaussian and Lorentzian curve was used. However, a separa-<br />
55


