

Measurements
Electron Spin Resonance and Transient Photocurrent ... - JuSER
Electron Spin Resonance and Transient Photocurrent ... - JuSER
- No tags were found...

You also want an ePaper? Increase the reach of your titles
YUMPU automatically turns print PDFs into web optimized ePapers that Google loves.
Chapter 5: N-Type Doped µc-Si:H<br />
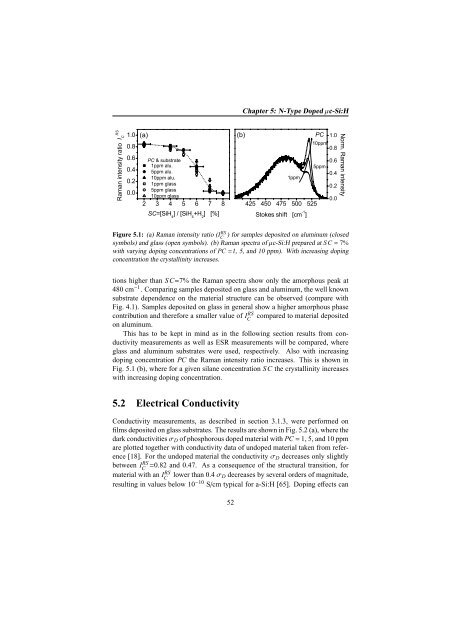
Figure 5.1: (a) Raman intensity ratio (IC<br />
RS ) for samples deposited on aluminum (closed<br />
symbols) and glass (open symbols). (b) Raman spectra of µc-Si:H prepared at SC = 7%<br />
with varying doping concentrations of PC =1, 5, and 10 ppm). With increasing doping<br />
concentration the crystallinity increases.<br />
tions higher than SC=7% the Raman spectra show only the amorphous peak at<br />
480 cm −1 . Comparing samples deposited on glass and aluminum, the well known<br />
substrate dependence on the material structure can be observed (compare with<br />
Fig. 4.1). Samples deposited on glass in general show a higher amorphous phase<br />
contribution and therefore a smaller value of IC<br />
RS compared to material deposited<br />
on aluminum.<br />
This has to be kept in mind as in the following section results from conductivity<br />
measurements as well as ESR measurements will be compared, where<br />
glass and aluminum substrates were used, respectively. Also with increasing<br />
doping concentration PC the Raman intensity ratio increases. This is shown in<br />
Fig. 5.1 (b), where for a given silane concentration SC the crystallinity increases<br />
with increasing doping concentration.<br />
5.2 Electrical Conductivity<br />
Conductivity measurements, as described in section 3.1.3, were performed on<br />
films deposited on glass substrates. The results are shown in Fig. 5.2 (a), where the<br />
dark conductivities σ D of phosphorous doped material with PC = 1, 5, and 10 ppm<br />
are plotted together with conductivity data of undoped material taken from reference<br />
[18]. For the undoped material the conductivity σ D decreases only slightly<br />
between IC<br />
RS =0.82 and 0.47. As a consequence of the structural transition, for<br />
material with an IC<br />
RS lower than 0.4 σ D decreases by several orders of magnitude,<br />
resulting in values below 10 −10 S/cm typical for a-Si:H [65]. Doping effects can<br />
52


