

Measurements
Electron Spin Resonance and Transient Photocurrent ... - JuSER
Electron Spin Resonance and Transient Photocurrent ... - JuSER
- No tags were found...

You also want an ePaper? Increase the reach of your titles
YUMPU automatically turns print PDFs into web optimized ePapers that Google loves.
Chapter 8: Schematic Density of States<br />
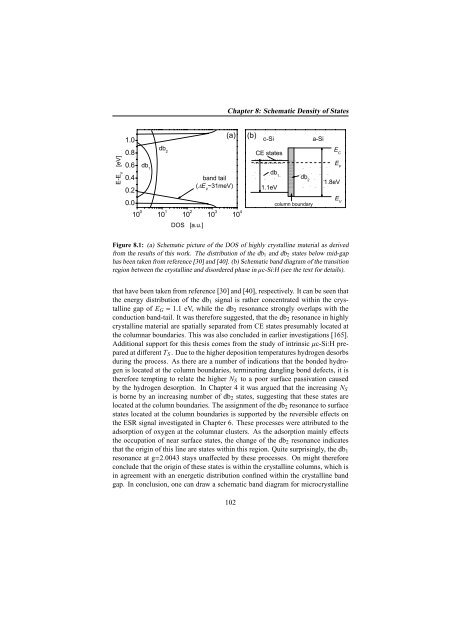
Figure 8.1: (a) Schematic picture of the DOS of highly crystalline material as derived<br />
from the results of this work. The distribution of the db 1 and db 2 states below mid-gap<br />
has been taken from reference [30] and [40]. (b) Schematic band diagram of the transition<br />
region between the crystalline and disordered phase in µc-Si:H (see the text for details).<br />
that have been taken from reference [30] and [40], respectively. It can be seen that<br />
the energy distribution of the db 1 signal is rather concentrated within the crystalline<br />
gap of E G = 1.1 eV, while the db 2 resonance strongly overlaps with the<br />
conduction band-tail. It was therefore suggested, that the db 2 resonance in highly<br />
crystalline material are spatially separated from CE states presumably located at<br />
the columnar boundaries. This was also concluded in earlier investigations [165].<br />
Additional support for this thesis comes from the study of intrinsic µc-Si:H prepared<br />
at different T S . Due to the higher deposition temperatures hydrogen desorbs<br />
during the process. As there are a number of indications that the bonded hydrogen<br />
is located at the column boundaries, terminating dangling bond defects, it is<br />
therefore tempting to relate the higher N S to a poor surface passivation caused<br />
by the hydrogen desorption. In Chapter 4 it was argued that the increasing N S<br />
is borne by an increasing number of db 2 states, suggesting that these states are<br />
located at the column boundaries. The assignment of the db 2 resonance to surface<br />
states located at the column boundaries is supported by the reversible effects on<br />
the ESR signal investigated in Chapter 6. These processes were attributed to the<br />
adsorption of oxygen at the columnar clusters. As the adsorption mainly effects<br />
the occupation of near surface states, the change of the db 2 resonance indicates<br />
that the origin of this line are states within this region. Quite surprisingly, the db 1<br />
resonance at g=2.0043 stays unaffected by these processes. On might therefore<br />
conclude that the origin of these states is within the crystalline columns, which is<br />
in agreement with an energetic distribution confined within the crystalline band<br />
gap. In conclusion, one can draw a schematic band diagram for microcrystalline<br />
102


