

Measurements
Electron Spin Resonance and Transient Photocurrent ... - JuSER
Electron Spin Resonance and Transient Photocurrent ... - JuSER
- No tags were found...

Create successful ePaper yourself
Turn your PDF publications into a flip-book with our unique Google optimized e-Paper software.
Chapter 6: Reversible and Irreversible Effects in µc-Si:H<br />
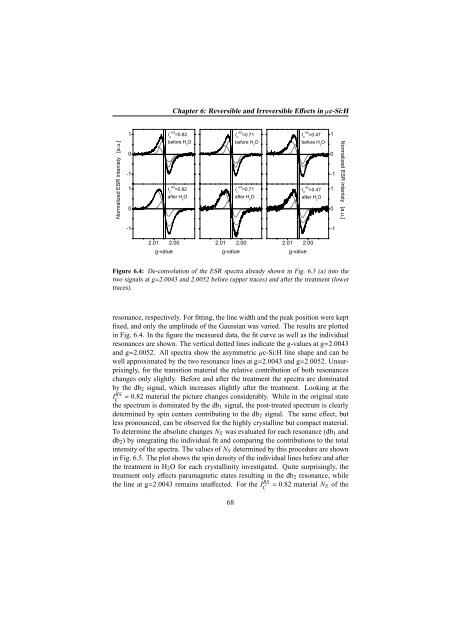
Figure 6.4: De-convolution of the ESR spectra already shown in Fig. 6.3 (a) into the<br />
two signals at g=2.0043 and 2.0052 before (upper traces) and after the treatment (lower<br />
traces).<br />
resonance, respectively. For fitting, the line width and the peak position were kept<br />
fixed, and only the amplitude of the Gaussian was varied. The results are plotted<br />
in Fig. 6.4. In the figure the measured data, the fit curve as well as the individual<br />
resonances are shown. The vertical dotted lines indicate the g-values at g=2.0043<br />
and g=2.0052. All spectra show the asymmetric µc-Si:H line shape and can be<br />
well approximated by the two resonance lines at g=2.0043 and g=2.0052. Unsurprisingly,<br />
for the transition material the relative contribution of both resonances<br />
changes only slightly. Before and after the treatment the spectra are dominated<br />
by the db 2 signal, which increases slightly after the treatment. Looking at the<br />
IC<br />
RS<br />
= 0.82 material the picture changes considerably. While in the original state<br />
the spectrum is dominated by the db 1 signal, the post-treated spectrum is clearly<br />
determined by spin centers contributing to the db 2 signal. The same effect, but<br />
less pronounced, can be observed for the highly crystalline but compact material.<br />
To determine the absolute changes N S was evaluated for each resonance (db 1 and<br />
db 2 ) by integrating the individual fit and comparing the contributions to the total<br />
intensity of the spectra. The values of N S determined by this procedure are shown<br />
in Fig. 6.5. The plot shows the spin density of the individual lines before and after<br />
the treatment in H 2 O for each crystallinity investigated. Quite surprisingly, the<br />
treatment only effects paramagnetic states resulting in the db 2 resonance, while<br />
the line at g=2.0043 remains unaffected. For the I RS<br />
C<br />
68<br />
= 0.82 material N S of the


