

Measurements
Electron Spin Resonance and Transient Photocurrent ... - JuSER
Electron Spin Resonance and Transient Photocurrent ... - JuSER
- No tags were found...

Create successful ePaper yourself
Turn your PDF publications into a flip-book with our unique Google optimized e-Paper software.
Chapter 4: Intrinsic Microcrystalline Silicon<br />
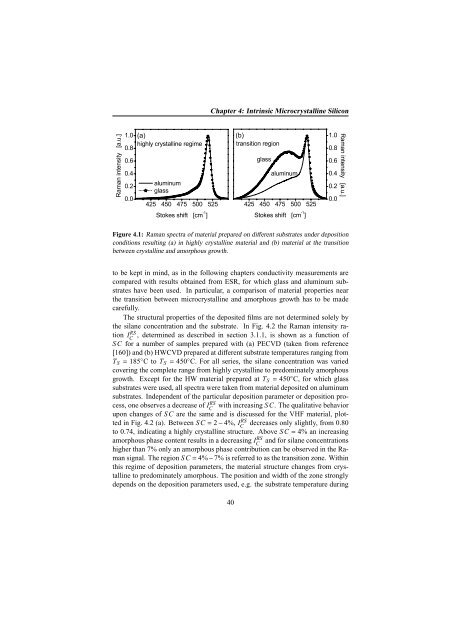
Figure 4.1: Raman spectra of material prepared on different substrates under deposition<br />
conditions resulting (a) in highly crystalline material and (b) material at the transition<br />
between crystalline and amorphous growth.<br />
to be kept in mind, as in the following chapters conductivity measurements are<br />
compared with results obtained from ESR, for which glass and aluminum substrates<br />
have been used. In particular, a comparison of material properties near<br />
the transition between microcrystalline and amorphous growth has to be made<br />
carefully.<br />
The structural properties of the deposited films are not determined solely by<br />
the silane concentration and the substrate. In Fig. 4.2 the Raman intensity ration<br />
IC<br />
RS , determined as described in section 3.1.1, is shown as a function of<br />
SC for a number of samples prepared with (a) PECVD (taken from reference<br />
[160]) and (b) HWCVD prepared at different substrate temperatures ranging from<br />
T S = 185 ◦ CtoT S = 450 ◦ C. For all series, the silane concentration was varied<br />
covering the complete range from highly crystalline to predominately amorphous<br />
growth. Except for the HW material prepared at T S = 450 ◦ C, for which glass<br />
substrates were used, all spectra were taken from material deposited on aluminum<br />
substrates. Independent of the particular deposition parameter or deposition process,<br />
one observes a decrease of IC<br />
RS with increasing SC. The qualitative behavior<br />
upon changes of SC are the same and is discussed for the VHF material, plotted<br />
in Fig. 4.2 (a). Between SC = 2 − 4%, IC RS decreases only slightly, from 0.80<br />
to 0.74, indicating a highly crystalline structure. Above SC = 4% an increasing<br />
amorphous phase content results in a decreasing IC<br />
RS and for silane concentrations<br />
higher than 7% only an amorphous phase contribution can be observed in the Raman<br />
signal. The region SC= 4%−7% is referred to as the transition zone. Within<br />
this regime of deposition parameters, the material structure changes from crystalline<br />
to predominately amorphous. The position and width of the zone strongly<br />
depends on the deposition parameters used, e.g. the substrate temperature during<br />
40


