

FCCC/CP/2015/7
1PYuHQM
1PYuHQM

You also want an ePaper? Increase the reach of your titles
YUMPU automatically turns print PDFs into web optimized ePapers that Google loves.
<strong>FCCC</strong>/<strong>CP</strong>/<strong>2015</strong>/7<br />
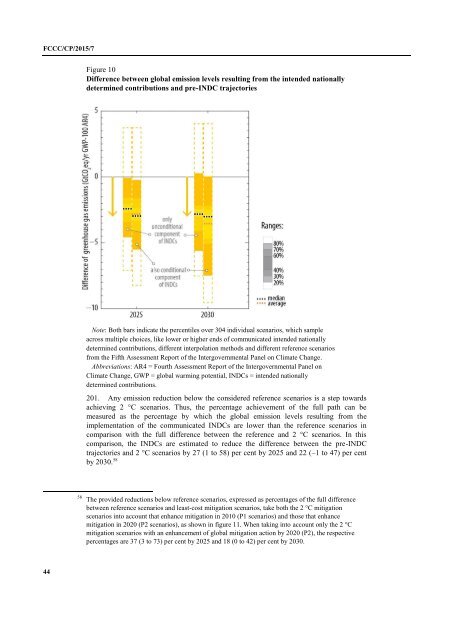
Figure 10<br />
Difference between global emission levels resulting from the intended nationally<br />
determined contributions and pre-INDC trajectories<br />
Note: Both bars indicate the percentiles over 304 individual scenarios, which sample<br />
across multiple choices, like lower or higher ends of communicated intended nationally<br />
determined contributions, different interpolation methods and different reference scenarios<br />
from the Fifth Assessment Report of the Intergovernmental Panel on Climate Change.<br />
Abbreviations: AR4 = Fourth Assessment Report of the Intergovernmental Panel on<br />
Climate Change, GWP = global warming potential, INDCs = intended nationally<br />
determined contributions.<br />
201. Any emission reduction below the considered reference scenarios is a step towards<br />
achieving 2 °C scenarios. Thus, the percentage achievement of the full path can be<br />
measured as the percentage by which the global emission levels resulting from the<br />
implementation of the communicated INDCs are lower than the reference scenarios in<br />
comparison with the full difference between the reference and 2 °C scenarios. In this<br />
comparison, the INDCs are estimated to reduce the difference between the pre-INDC<br />
trajectories and 2 °C scenarios by 27 (1 to 58) per cent by 2025 and 22 (–1 to 47) per cent<br />
by 2030. 58<br />
58 The provided reductions below reference scenarios, expressed as percentages of the full difference<br />
between reference scenarios and least-cost mitigation scenarios, take both the 2 °C mitigation<br />
scenarios into account that enhance mitigation in 2010 (P1 scenarios) and those that enhance<br />
mitigation in 2020 (P2 scenarios), as shown in figure 11. When taking into account only the 2 °C<br />
mitigation scenarios with an enhancement of global mitigation action by 2020 (P2), the respective<br />
percentages are 37 (3 to 73) per cent by 2025 and 18 (0 to 42) per cent by 2030.<br />
44