

FCCC/CP/2015/7
1PYuHQM
1PYuHQM

Create successful ePaper yourself
Turn your PDF publications into a flip-book with our unique Google optimized e-Paper software.
<strong>FCCC</strong>/<strong>CP</strong>/<strong>2015</strong>/7<br />
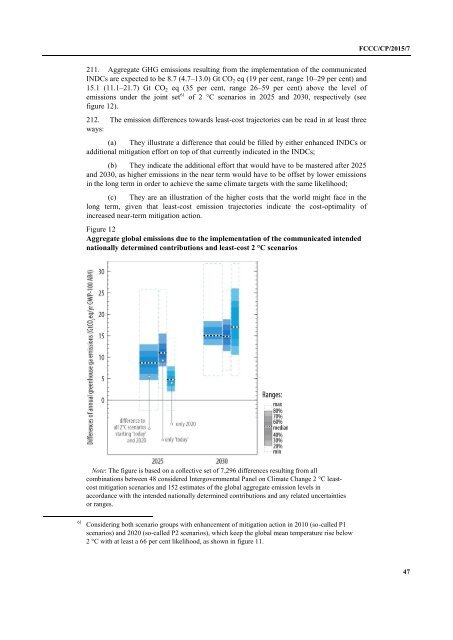
211. Aggregate GHG emissions resulting from the implementation of the communicated<br />
INDCs are expected to be 8.7 (4.7–13.0) Gt CO 2 eq (19 per cent, range 10–29 per cent) and<br />
15.1 (11.1–21.7) Gt CO 2 eq (35 per cent, range 26–59 per cent) above the level of<br />
emissions under the joint set 61 of 2 °C scenarios in 2025 and 2030, respectively (see<br />
figure 12).<br />
212. The emission differences towards least-cost trajectories can be read in at least three<br />
ways:<br />
(a) They illustrate a difference that could be filled by either enhanced INDCs or<br />
additional mitigation effort on top of that currently indicated in the INDCs;<br />
(b) They indicate the additional effort that would have to be mastered after 2025<br />
and 2030, as higher emissions in the near term would have to be offset by lower emissions<br />
in the long term in order to achieve the same climate targets with the same likelihood;<br />
(c) They are an illustration of the higher costs that the world might face in the<br />
long term, given that least-cost emission trajectories indicate the cost-optimality of<br />
increased near-term mitigation action.<br />
Figure 12<br />
Aggregate global emissions due to the implementation of the communicated intended<br />
nationally determined contributions and least-cost 2 °C scenarios<br />
Note: The figure is based on a collective set of 7,296 differences resulting from all<br />
combinations between 48 considered Intergovernmental Panel on Climate Change 2 °C leastcost<br />
mitigation scenarios and 152 estimates of the global aggregate emission levels in<br />
accordance with the intended nationally determined contributions and any related uncertainties<br />
or ranges.<br />
61 Considering both scenario groups with enhancement of mitigation action in 2010 (so-called P1<br />
scenarios) and 2020 (so-called P2 scenarios), which keep the global mean temperature rise below<br />
2 °C with at least a 66 per cent likelihood, as shown in figure 11.<br />
47