

DIVING
AnnualDivingReport-2015Edition
AnnualDivingReport-2015Edition

You also want an ePaper? Increase the reach of your titles
YUMPU automatically turns print PDFs into web optimized ePapers that Google loves.
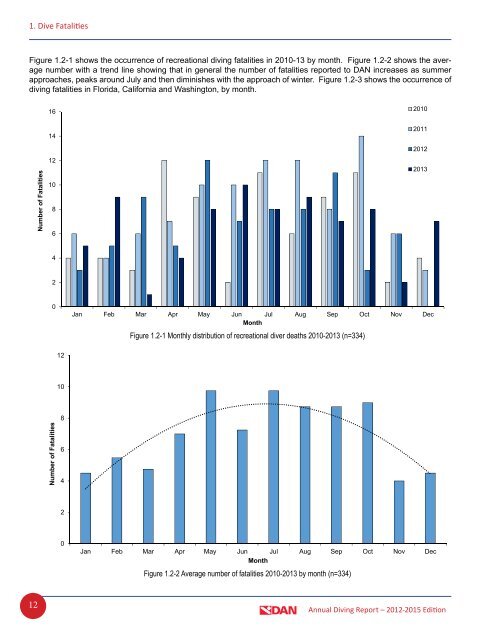
1. Dive Fatalities<br />
Figure 1.2-1 shows the occurrence of recreational diving fatalities in 2010-13 by month. Figure 1.2-2 shows the average<br />
number with a trend line showing that in general the number of fatalities reported to DAN increases as summer<br />
approaches, peaks around July and then diminishes with the approach of winter. Figure 1.2-3 shows the occurrence of<br />
diving fatalities in Florida, California and Washington, by month.<br />
16<br />
2010<br />
Number of Fatalities<br />
14<br />
12<br />
10<br />
8<br />
6<br />
2011<br />
2012<br />
2013<br />
4<br />
2<br />
0<br />
Jan Feb Mar Apr May Jun Jul Aug Sep Oct Nov Dec<br />
Month<br />
Figure 1.2-1 Monthly distribution of recreational diver deaths 2010-2013 (n=334)<br />
12<br />
10<br />
Number of Fatalities<br />
8<br />
6<br />
4<br />
2<br />
0<br />
Jan Feb Mar Apr May Jun Jul Aug Sep Oct Nov Dec<br />
Month<br />
Figure 1.2-2 Average number of fatalities 2010-2013 by month (n=334)<br />
12<br />
Annual Diving Report – 2012-2015 Edition