

DIVING
AnnualDivingReport-2015Edition
AnnualDivingReport-2015Edition

Create successful ePaper yourself
Turn your PDF publications into a flip-book with our unique Google optimized e-Paper software.
2. Dive Injuries<br />
1400<br />
1200<br />
Estimated number of cases<br />
1000<br />
800<br />
600<br />
400<br />
200<br />
0<br />
Jan Feb Mar Apr May Jun Jul Aug Sep Oct Nov Dec<br />
Month<br />
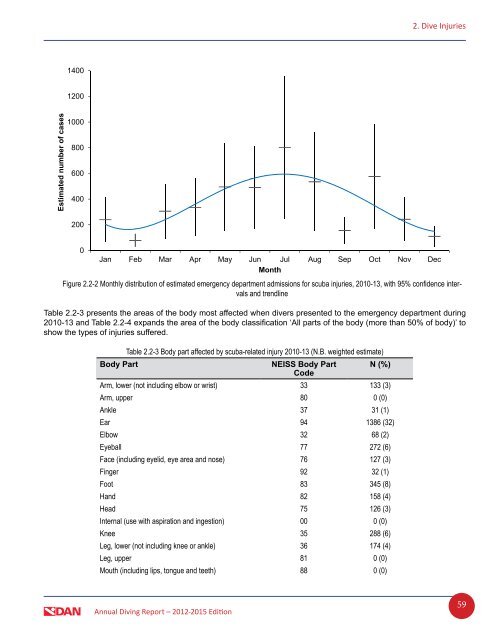
Figure 2.2-2 Monthly distribution of estimated emergency department admissions for scuba injuries, 2010-13, with 95% confidence intervals<br />
and trendline<br />
Table 2.2-3 presents the areas of the body most affected when divers presented to the emergency department during<br />
2010-13 and Table 2.2-4 expands the area of the body classification ‘All parts of the body (more than 50% of body)’ to<br />
show the types of injuries suffered.<br />
Table 2.2-3 Body part affected by scuba-related injury 2010-13 (N.B. weighted estimate)<br />
Body Part<br />
NEISS Body Part N (%)<br />
Code<br />
Arm, lower (not including elbow or wrist) 33 133 (3)<br />
Arm, upper 80 0 (0)<br />
Ankle 37 31 (1)<br />
Ear 94 1386 (32)<br />
Elbow 32 68 (2)<br />
Eyeball 77 272 (6)<br />
Face (including eyelid, eye area and nose) 76 127 (3)<br />
Finger 92 32 (1)<br />
Foot 83 345 (8)<br />
Hand 82 158 (4)<br />
Head 75 126 (3)<br />
Internal (use with aspiration and ingestion) 00 0 (0)<br />
Knee 35 288 (6)<br />
Leg, lower (not including knee or ankle) 36 174 (4)<br />
Leg, upper 81 0 (0)<br />
Mouth (including lips, tongue and teeth) 88 0 (0)<br />
Annual Diving Report – 2012-2015 Edition<br />
59