

DIVING
AnnualDivingReport-2015Edition
AnnualDivingReport-2015Edition

You also want an ePaper? Increase the reach of your titles
YUMPU automatically turns print PDFs into web optimized ePapers that Google loves.
2. Dive Injuries<br />
2.2 Dive Injuries - Emergency Department Admissions<br />
Peter Buzzacott<br />
The US Consumer Product Safety Commission (CPSC) maintains a National Electronic Injury Surveillance System<br />
(NEISS) that includes 100 Emergency Departments (ED) in the US and US Territories. Originally, only injuries associated<br />
with consumer products were entered into the database but since 2000, patient information has been collected for all<br />
emergency department presentations involving injuries. Each emergency department is awarded a statistical weighting<br />
and, from these weightings, an estimate of the total number of similar injuries nationwide can be made, with 95% confidence<br />
intervals. The data are publicly available here: http://www.cpsc.gov/en/Research--Statistics/NEISS-Injury-Data/<br />
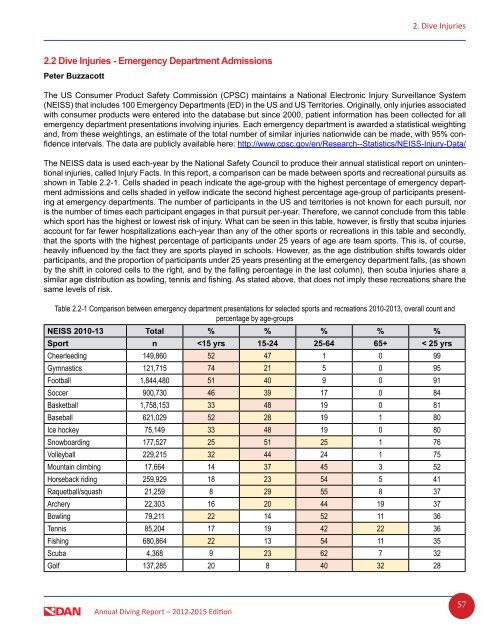
The NEISS data is used each-year by the National Safety Council to produce their annual statistical report on unintentional<br />
injuries, called Injury Facts. In this report, a comparison can be made between sports and recreational pursuits as<br />
shown in Table 2.2-1. Cells shaded in peach indicate the age-group with the highest percentage of emergency department<br />
admissions and cells shaded in yellow indicate the second highest percentage age-group of participants presenting<br />
at emergency departments. The number of participants in the US and territories is not known for each pursuit, nor<br />
is the number of times each participant engages in that pursuit per-year. Therefore, we cannot conclude from this table<br />
which sport has the highest or lowest risk of injury. What can be seen in this table, however, is firstly that scuba injuries<br />
account for far fewer hospitalizations each-year than any of the other sports or recreations in this table and secondly,<br />
that the sports with the highest percentage of participants under 25 years of age are team sports. This is, of course,<br />
heavily influenced by the fact they are sports played in schools. However, as the age distribution shifts towards older<br />
participants, and the proportion of participants under 25 years presenting at the emergency department falls, (as shown<br />
by the shift in colored cells to the right, and by the falling percentage in the last column), then scuba injuries share a<br />
similar age distribution as bowling, tennis and fishing. As stated above, that does not imply these recreations share the<br />
same levels of risk.<br />
Table 2.2-1 Comparison between emergency department presentations for selected sports and recreations 2010-2013, overall count and<br />
percentage by age-groups<br />
NEISS 2010-13 Total % % % % %<br />
Sport n