

DIVING
AnnualDivingReport-2015Edition
AnnualDivingReport-2015Edition

Create successful ePaper yourself
Turn your PDF publications into a flip-book with our unique Google optimized e-Paper software.
2. Dive Injuries<br />
There were 136 cases involving scuba, equating to 4,368 estimated emergency department presentations (95% CI<br />
1,334, 7,400), with an estimated 1114 in 2010, 518 in 2011, 1297 in 2012 and 1438 in 2013. Of those, 3,159 (72%)<br />
were male and 1,209 (28%) female. Care should be taken when extrapolating small raw numbers, in this case probably<br />
anything less than 2000 cases, because a few extra cases in the sample can grossly inflate the estimated number of<br />
cases. That said, the following tables and figures offer a guide only to the types of injuries that might be seen in any<br />
year in emergency departments that receive divers. The actual number might vary from almost zero cases to twice as<br />
many as estimated (that is, the confidence interval) as shown in Figure 2.2-2, the monthly estimated number of cases<br />
with confidence interval whiskers.<br />
The estimated mean age of patients presenting at emergency departments with scuba related injuries is shown in Table<br />
2.2-2. The wide confidence intervals indicate how imprecise these estimates are.<br />
Table 2.2-2 Estimated mean age of patients presenting at emergency departments for scuba related injuries between 2010-13, by sex<br />
Sex n (%) Mean Age (yrs) 95% CI<br />
Female 1,209 (28) 36.1 10.9, 61.3<br />
Male 3,159 (72) 38.7 11.9, 65.6<br />
Total 4,368 (100) 38.0 11.6, 64.4<br />
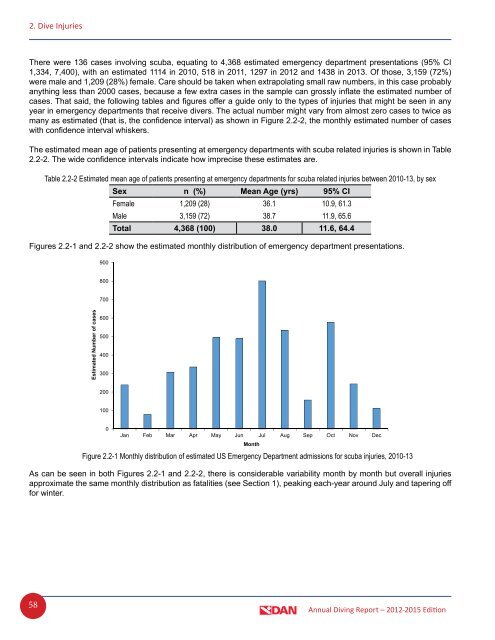
Figures 2.2-1 and 2.2-2 show the estimated monthly distribution of emergency department presentations.<br />
900<br />
800<br />
700<br />
Estimated Number of cases<br />
600<br />
500<br />
400<br />
300<br />
200<br />
100<br />
0<br />
Jan Feb Mar Apr May Jun Jul Aug Sep Oct Nov Dec<br />
Month<br />
Figure 2.2-1 Monthly distribution of estimated US Emergency Department admissions for scuba injuries, 2010-13<br />
As can be seen in both Figures 2.2-1 and 2.2-2, there is considerable variability month by month but overall injuries<br />
approximate the same monthly distribution as fatalities (see Section 1), peaking each-year around July and tapering off<br />
for winter.<br />
58<br />
Annual Diving Report – 2012-2015 Edition