

ENFANTS TERRIBLES
enfants-terribles
enfants-terribles

You also want an ePaper? Increase the reach of your titles
YUMPU automatically turns print PDFs into web optimized ePapers that Google loves.
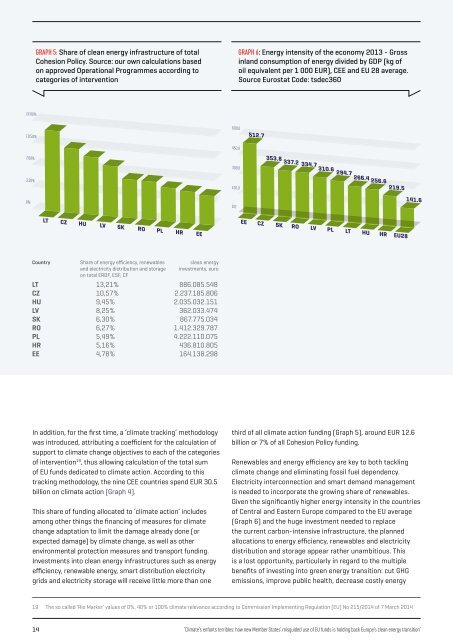
GRAPH 5: Share of clean energy infrastructure of total<br />
Cohesion Policy. Source: our own calculations based<br />
on approved Operational Programmes according to<br />
categories of intervention<br />
GRAPH 6: Energy intensity of the economy 2013 - Gross<br />
inland consumption of energy divided by GDP (kg of<br />
oil equivalent per 1 000 EUR), CEE and EU 28 average.<br />
Source Eurostat Code: tsdec360<br />
14.00% 600.0<br />
10.50%<br />
512.7<br />
450.0<br />
7.00%<br />
353.8 337.2 334.7 310.6 294.7 266.4 256.6<br />
219.5<br />
141.6<br />
300.0<br />
3.50%<br />
150.0<br />
0%<br />
0.0<br />
LT CZ HU LV SK RO PL HR EE<br />
EE CZ SK RO LV PL LT HU HR EU28<br />
Country Share of energy efficiency, renewables clean energy<br />
and electricity distribution and storage investments, euro<br />
on total ERDF, ESF, CF<br />
LT 13,21% 886.085.548<br />
CZ 10,57% 2.237.185.806<br />
HU 9,45% 2.035.032.151<br />
LV 8,25% 362.033.474<br />
SK 6,30% 867.775.034<br />
RO 6,27% 1.412.329.787<br />
PL 5,49% 4.222.110.075<br />
HR 5,16% 436.810.805<br />
EE 4,78% 164.138.298<br />
In addition, for the first time, a ‘climate tracking’ methodology<br />
was introduced, attributing a coefficient for the calculation of<br />
support to climate change objectives to each of the categories<br />
of intervention 19 , thus allowing calculation of the total sum<br />
of EU funds dedicated to climate action. According to this<br />
tracking methodology, the nine CEE countries spend EUR 30.5<br />
billion on climate action (Graph 4).<br />
This share of funding allocated to ‘climate action’ includes<br />
among other things the financing of measures for climate<br />
change adaptation to limit the damage already done (or<br />
expected damage) by climate change, as well as other<br />
environmental protection measures and transport funding.<br />
Investments into clean energy infrastructures such as energy<br />
efficiency, renewable energy, smart distribution electricity<br />
grids and electricity storage will receive little more than one<br />
third of all climate action funding (Graph 5), around EUR 12.6<br />
billion or 7% of all Cohesion Policy funding.<br />
Renewables and energy efficiency are key to both tackling<br />
climate change and eliminating fossil fuel dependency.<br />
Electricity interconnection and smart demand management<br />
is needed to incorporate the growing share of renewables.<br />
Given the significantly higher energy intensity in the countries<br />
of Central and Eastern Europe compared to the EU average<br />
(Graph 6) and the huge investment needed to replace<br />
the current carbon-intensive infrastructure, the planned<br />
allocations to energy efficiency, renewables and electricity<br />
distribution and storage appear rather unambitious. This<br />
is a lost opportunity, particularly in regard to the multiple<br />
benefits of investing into green energy transition: cut GHG<br />
emissions, improve public health, decrease costly energy<br />
19<br />
The so called ‘Rio Marker’ values of 0%, 40% or 100% climate relevance according to Commission Implementing Regulation (EU) No 215/2014 of 7 March 2014<br />
14<br />
‘Climate’s enfants terribles: how new Member States’ misguided use of EU funds is holding back Europe’s clean energy transition’