

ENFANTS TERRIBLES
enfants-terribles
enfants-terribles

Create successful ePaper yourself
Turn your PDF publications into a flip-book with our unique Google optimized e-Paper software.
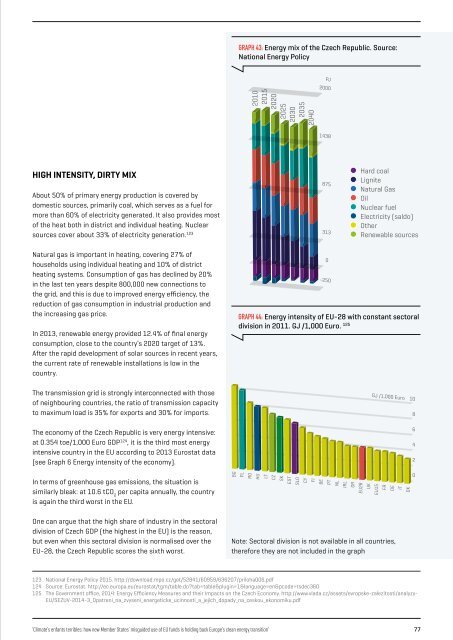
GRAPH 43: Energy mix of the Czech Republic. Source:<br />
National Energy Policy<br />
PJ<br />
2000<br />
HIGH INTENSITY, DIRTY MIX<br />
About 50% of primary energy production is covered by<br />
domestic sources, primarily coal, which serves as a fuel for<br />
more than 60% of electricity generated. It also provides most<br />
of the heat both in district and individual heating. Nuclear<br />
sources cover about 33% of electricity generation. 123<br />
Natural gas is important in heating, covering 27% of<br />
households using individual heating and 10% of district<br />
heating systems. Consumption of gas has declined by 20%<br />
in the last ten years despite 800,000 new connections to<br />
the grid, and this is due to improved energy efficiency, the<br />
reduction of gas consumption in industrial production and<br />
the increasing gas price.<br />
In 2013, renewable energy provided 12.4% of final energy<br />
consumption, close to the country’s 2020 target of 13%.<br />
After the rapid development of solar sources in recent years,<br />
the current rate of renewable installations is low in the<br />
country.<br />
GRAPH 44: Energy intensity of EU-28 with constant sectoral<br />
division in 2011. GJ /1,000 Euro. 125<br />
The transmission grid is strongly interconnected with those<br />
of neighbouring countries, the ratio of transmission capacity<br />
to maximum load is 35% for exports and 30% for imports.<br />
The economy of the Czech Republic is very energy intensive:<br />
at 0.354 toe/1,000 Euro GDP 124 , it is the third most energy<br />
intensive country in the EU according to 2013 Eurostat data<br />
(see Graph 6 Energy intensity of the economy).<br />
GJ /1,000 Euro 10<br />
8<br />
6<br />
4<br />
2<br />
In terms of greenhouse gas emissions, the situation is<br />
similarly bleak: at 10.6 tCO 2<br />
per capita annually, the country<br />
is again the third worst in the EU.<br />
BG<br />
PL<br />
RO<br />
HU<br />
LT<br />
CZ<br />
SK<br />
EST<br />
SLO<br />
CY<br />
FI<br />
BE<br />
PT<br />
NL<br />
IRL<br />
GR<br />
EU28<br />
UK<br />
EU15<br />
FR<br />
DE<br />
2010<br />
2015<br />
2020<br />
2025<br />
2030<br />
2035<br />
2040<br />
1438<br />
875<br />
313<br />
Hard coal<br />
Lignite<br />
Natural Gas<br />
Oil<br />
Nuclear fuel<br />
Electricity (saldo)<br />
Other<br />
Renewable sources<br />
0<br />
-250<br />
IT<br />
DK<br />
0<br />
One can argue that the high share of industry in the sectoral<br />
division of Czech GDP (the highest in the EU) is the reason,<br />
but even when this sectoral division is normalised over the<br />
EU-28, the Czech Republic scores the sixth worst.<br />
Note: Sectoral division is not available in all countries,<br />
therefore they are not included in the graph<br />
123<br />
124<br />
125<br />
National Energy Policy 2015. http://download.mpo.cz/get/52841/60959/636207/priloha006.pdf<br />
Source: Eurostat. http://ec.europa.eu/eurostat/tgm/table.do?tab=table&plugin=1&language=en&pcode=tsdec360<br />
The Government office, 2014: Energy Efficiency Measures and their Impacts on the Czech Economy. http://www.vlada.cz/assets/evropske-zalezitosti/analyzy-<br />
EU/SEZUV-2014-3_Opatreni_na_zvyseni_energeticke_ucinnosti_a_jejich_dopady_na_ceskou_ekonomiku.pdf<br />
‘Climate’s enfants terribles: how new Member States’ misguided use of EU funds is holding back Europe’s clean energy transition’ 77