

ENFANTS TERRIBLES
enfants-terribles
enfants-terribles

You also want an ePaper? Increase the reach of your titles
YUMPU automatically turns print PDFs into web optimized ePapers that Google loves.
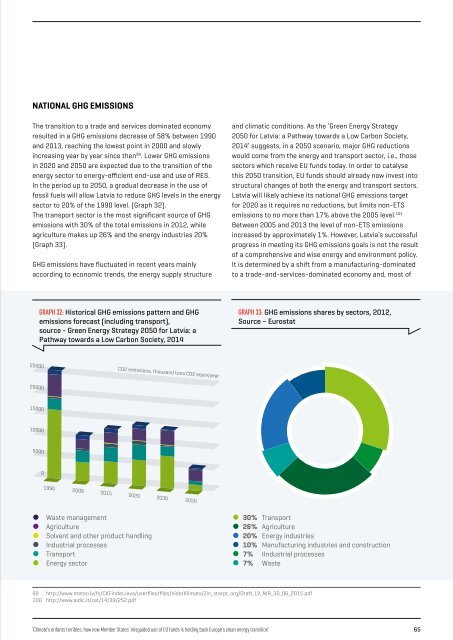
NATIONAL GHG EMISSIONS<br />
The transition to a trade and services dominated economy<br />
resulted in a GHG emissions decrease of 58% between 1990<br />
and 2013, reaching the lowest point in 2000 and slowly<br />
increasing year by year since then 99 . Lower GHG emissions<br />
in 2020 and 2050 are expected due to the transition of the<br />
energy sector to energy-efficient end-use and use of RES.<br />
In the period up to 2050, a gradual decrease in the use of<br />
fossil fuels will allow Latvia to reduce GHG levels in the energy<br />
sector to 20% of the 1990 level. (Graph 32).<br />
The transport sector is the most significant source of GHG<br />
emissions with 30% of the total emissions in 2012, while<br />
agriculture makes up 26% and the energy industries 20%<br />
(Graph 33).<br />
GHG emissions have fluctuated in recent years mainly<br />
according to economic trends, the energy supply structure<br />
and climatic conditions. As the ‘Green Energy Strategy<br />
2050 for Latvia: a Pathway towards a Low Carbon Society,<br />
2014’ suggests, in a 2050 scenario, major GHG reductions<br />
would come from the energy and transport sector, i.e., those<br />
sectors which receive EU funds today. In order to catalyse<br />
this 2050 transition, EU funds should already now invest into<br />
structural changes of both the energy and transport sectors.<br />
Latvia will likely achieve its national GHG emissions target<br />
for 2020 as it requires no reductions, but limits non-ETS<br />
emissions to no more than 17% above the 2005 level. 101<br />
Between 2005 and 2013 the level of non-ETS emissions<br />
increased by approximately 1%. However, Latvia’s successful<br />
progress in meeting its GHG emissions goals is not the result<br />
of a comprehensive and wise energy and environment policy.<br />
It is determined by a shift from a manufacturing-dominated<br />
to a trade-and-services-dominated economy and, most of<br />
GRAPH 32: Historical GHG emissions pattern and GHG<br />
emissions forecast (including transport),<br />
source - Green Energy Strategy 2050 for Latvia: a<br />
Pathway towards a Low Carbon Society, 2014<br />
GRAPH 33: GHG emissions shares by sectors, 2012,<br />
Source – Eurostat<br />
25000<br />
CO2 emissions, thousand tons CO2 equiv/year<br />
20000<br />
15000<br />
10000<br />
5000<br />
0<br />
1990 2009 2015 2020 2030 2050<br />
Waste management<br />
Agriculture<br />
Solvent and other product handling<br />
Industrial processes<br />
Transport<br />
Energy sector<br />
30% Transport<br />
26% Agriculture<br />
20% Energy industries<br />
10% Manufacturing industries and construction<br />
7% IIndustrial processes<br />
7% Waste<br />
99<br />
100<br />
http://www.meteo.lv/fs/CKFinderJava/userfiles/files/Vide/Klimats/Zin_starpt_org/Draft_LV_NIR_30_06_2015.pdf<br />
http://www.aidic.it/cet/14/39/252.pdf<br />
‘Climate’s enfants terribles: how new Member States’ misguided use of EU funds is holding back Europe’s clean energy transition’ 65