

ENFANTS TERRIBLES
enfants-terribles
enfants-terribles

Create successful ePaper yourself
Turn your PDF publications into a flip-book with our unique Google optimized e-Paper software.
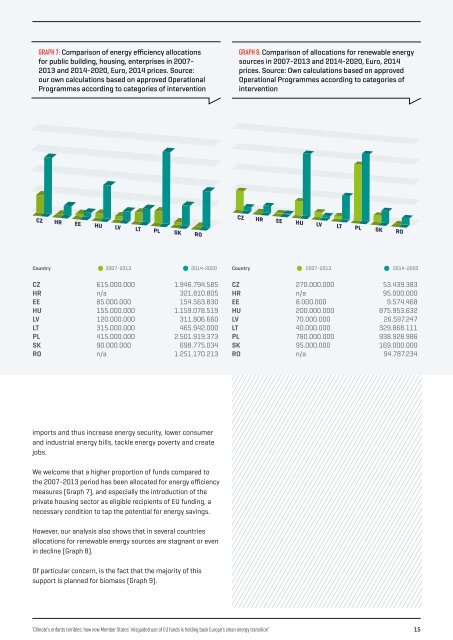
GRAPH 7: Comparison of energy efficiency allocations<br />
for public building, housing, enterprises in 2007-<br />
2013 and 2014-2020, Euro, 2014 prices. Source:<br />
our own calculations based on approved Operational<br />
Programmes according to categories of intervention<br />
GRAPH 8: Comparison of allocations for renewable energy<br />
sources in 2007-2013 and 2014-2020, Euro, 2014<br />
prices. Source: Own calculations based on approved<br />
Operational Programmes according to categories of<br />
intervention<br />
CZ HR EE HU LV LT PL SK RO<br />
CZ HR EE HU LV LT PL SK RO<br />
Country 2007-2013 2014-2020 Country 2007-2013 2014-2020<br />
CZ 615.000.000 1.946.794.585<br />
HR n/a 321.810.805<br />
EE 85.000.000 154.563.830<br />
HU 155.000.000 1.159.078.519<br />
LV 120.000.000 311.806.660<br />
LT 315.000.000 465.942.000<br />
PL 415.000.000 2.501.919.373<br />
SK 90.000.000 698.775.034<br />
RO n/a 1.251.170.213<br />
CZ 270.000.000 53.439.383<br />
HR n/a 95.000.000<br />
EE 8.000.000 9.574.468<br />
HU 200.000.000 875.953.632<br />
LV 70.000.000 26.597.247<br />
LT 40.000.000 329.868.111<br />
PL 780.000.000 938.928.986<br />
SK 95.000.000 169.000.000<br />
RO n/a 94.787.234<br />
imports and thus increase energy security, lower consumer<br />
and industrial energy bills, tackle energy poverty and create<br />
jobs.<br />
We welcome that a higher proportion of funds compared to<br />
the 2007-2013 period has been allocated for energy efficiency<br />
measures (Graph 7), and especially the introduction of the<br />
private housing sector as eligible recipients of EU funding, a<br />
necessary condition to tap the potential for energy savings.<br />
However, our analysis also shows that in several countries<br />
allocations for renewable energy sources are stagnant or even<br />
in decline (Graph 8).<br />
Of particular concern, is the fact that the majority of this<br />
support is planned for biomass (Graph 9).<br />
‘Climate’s enfants terribles: how new Member States’ misguided use of EU funds is holding back Europe’s clean energy transition’ 15