

ENFANTS TERRIBLES
enfants-terribles
enfants-terribles

Create successful ePaper yourself
Turn your PDF publications into a flip-book with our unique Google optimized e-Paper software.
intensity has decreased over the last two decades, but it is still<br />
significantly above the EU average (Graph 27). Based on these<br />
developments, the Europe 2020 energy and climate targets<br />
are within reach: a limited increase in GHG emissions of 15%<br />
from the non-ETC sectors, an increase of renewable energy<br />
sources up to 23% and an increase in energy efficiency of 17%.<br />
Considering the above achievements, it is commonly<br />
accepted at the political level that Lithuania has<br />
implemented all international treaties and obligations<br />
regarding climate change and is on track to reach the<br />
Europe 2020 targets on time. Such a conviction, to some<br />
extent, determines why only 20.95% of the total Cohesion<br />
Policy funds are committed to securing climate change<br />
mainstreaming. This is presumed to be sufficient support for<br />
a further shift towards a low carbon economy in all sectors<br />
as these goals have been achieved without any specific<br />
measures to address climate change mitigation objectives.<br />
However, the missing implementation pathway for the clean<br />
energy transformation makes it difficult to evaluate current<br />
developments and actions in relation to the outlined long-term<br />
goals. Even with regard to Europe 2020 goals, the situation<br />
remains challenging. Energy efficiency still has to be improved,<br />
and Lithuania has not yet transposed the requirements of<br />
the Energy Efficiency Directive into national law. In view of its<br />
overall CO 2<br />
emissions reduction, it is usually forgotten that<br />
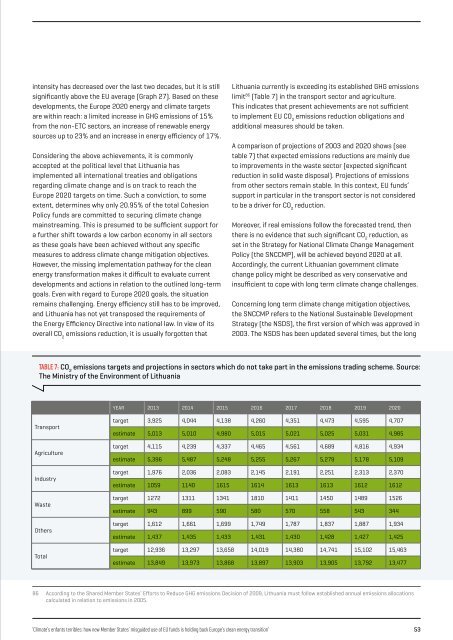
Lithuania currently is exceeding its established GHG emissions<br />
limit 86 (Table 7) in the transport sector and agriculture.<br />
This indicates that present achievements are not sufficient<br />
to implement EU CO 2<br />
emissions reduction obligations and<br />
additional measures should be taken.<br />
A comparison of projections of 2003 and 2020 shows (see<br />
table 7) that expected emissions reductions are mainly due<br />
to improvements in the waste sector (expected significant<br />
reduction in solid waste disposal). Projections of emissions<br />
from other sectors remain stable. In this context, EU funds’<br />
support in particular in the transport sector is not considered<br />
to be a driver for CO 2<br />
reduction.<br />
Moreover, if real emissions follow the forecasted trend, then<br />
there is no evidence that such significant CO 2<br />
reduction, as<br />
set in the Strategy for National Climate Change Management<br />
Policy (the SNCCMP), will be achieved beyond 2020 at all.<br />
Accordingly, the current Lithuanian government climate<br />
change policy might be described as very conservative and<br />
insufficient to cope with long term climate change challenges.<br />
Concerning long term climate change mitigation objectives,<br />
the SNCCMP refers to the National Sustainable Development<br />
Strategy (the NSDS), the first version of which was approved in<br />
2003. The NSDS has been updated several times, but the long<br />
TABLE 7: CO 2<br />
emissions targets and projections in sectors which do not take part in the emissions trading scheme. Source:<br />
The Ministry of the Environment of Lithuania<br />
YEAR 2013 2014 2015 2016 2017 2018 2019 2020<br />
Transport<br />
Agriculture<br />
Industry<br />
Waste<br />
Others<br />
Total<br />
target 3,925 4,044 4,138 4,260 4,351 4,473 4,595 4,707<br />
estimate 5,013 5,010 4,980 5,015 5,021 5,025 5,031 4,985<br />
target 4,115 4,239 4,337 4,465 4,561 4,689 4,816 4,934<br />
estimate 5,396 5,487 5,248 5,255 5,267 5,279 5,178 5,109<br />
target 1,976 2,036 2,083 2,145 2,191 2,251 2,313 2,370<br />
estimate 1059 1140 1615 1614 1613 1613 1612 1612<br />
target 1272 1311 1341 1810 1411 1450 1489 1526<br />
estimate 943 899 590 580 570 558 543 344<br />
target 1,612 1,661 1,699 1,749 1,787 1,837 1,887 1,934<br />
estimate 1,437 1,435 1,433 1,431 1,430 1,428 1,427 1,425<br />
target 12,936 13,297 13,658 14,019 14,380 14,741 15,102 15,463<br />
estimate 13,849 13,973 13,868 13,897 13,903 13,905 13,792 13,477<br />
86<br />
According to the Shared Member States’ Efforts to Reduce GHG emissions Decision of 2009, Lithuania must follow established annual emissions allocations<br />
calculated in relation to emissions in 2005.<br />
‘Climate’s enfants terribles: how new Member States’ misguided use of EU funds is holding back Europe’s clean energy transition’ 53