

ENFANTS TERRIBLES
enfants-terribles
enfants-terribles

You also want an ePaper? Increase the reach of your titles
YUMPU automatically turns print PDFs into web optimized ePapers that Google loves.
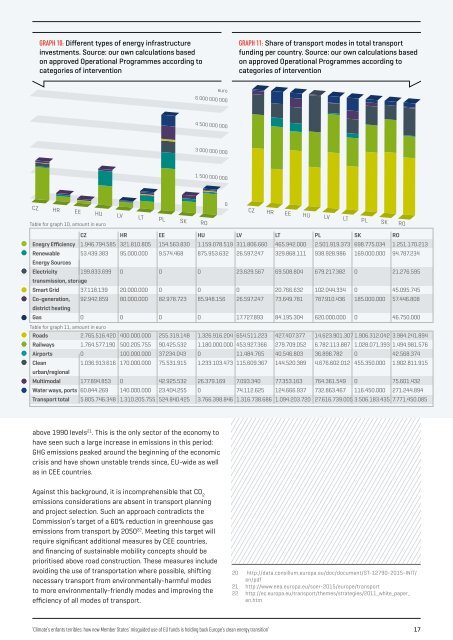
GRAPH 10: Different types of energy infrastructure<br />
investments. Source: our own calculations based<br />
on approved Operational Programmes according to<br />
categories of intervention<br />
GRAPH 11: Share of transport modes in total transport<br />
funding per country. Source: our own calculations based<br />
on approved Operational Programmes according to<br />
categories of intervention<br />
euro<br />
6 000 000 000<br />
4 500 000 000<br />
3 000 000 000<br />
1 500 000 000<br />
0<br />
CZ HR EE HU LV LT PL SK RO<br />
Table for graph 10, amount in euro<br />
CZ HR EE HU LV LT PL SK RO<br />
CZ HR EE HU LV LT PL SK RO<br />
Enegry Efficiency 1.946.794.585 321.810.805 154.563.830 1.159.078.519 311.806.660 465.942.000 2.501.919.373 698.775.034 1.251.170.213<br />
Renewable 53.439.383 95.000.000 9.574.468 875.953.632 26.597.247 329.868.111 938.928.986 169.000.000 94.787.234<br />
Energy Sources<br />
Electricity 199.833.699 0 0 0 23.629.567 69.508.804 679.217.382 0 21.276.595<br />
transmission, storage<br />
Smart Grid 37.118.139 20.000.000 0 0 0 20.766.632 102.044.334 0 45.095.745<br />
Co-generation, 92.942.859 80.000.000 82.978.723 85.948.156 26.597.247 73.649.781 787.910.436 185.000.000 57.446.808<br />
district heating<br />
Gas 0 0 0 0 17.727.893 84.195.304 620.000.000 0 46.750.000<br />
Table for graph 11, amount in euro<br />
Roads 2.765.516.420 400.000.000 255.319.148 1.326.916.204 654.511.223 427.407.377 14.623.901.307 1.906.312.042 3.984.241.894<br />
Railways 1.764.577.190 500.205.755 90.425.532 1.180.000.000 453.927.366 279.709.052 6.782.113.887 1.028.071.393 1.494.981.576<br />
Airports 0 100.000.000 37.234.043 0 11.484.765 40.546.803 36.896.782 0 42.568.374<br />
Clean 1.036.913.616 170.000.000 75.531.915 1.233.103.473 115.609.367 144.520.389 4.676.602.012 455.350.000 1.902.811.915<br />
urban/regional<br />
Multimodal 177.894.853 0 42.925.532 26.379.169 7.093.340 77.353.163 764.361.549 0 75.601.432<br />
Water ways, ports 60.844.269 140.000.000 23.404.255 0 74.112.625 124.666.937 732.863.467 116.450.000 271.244.894<br />
Transport total 5.805.746.348 1.310.205.755 524.840.425 3.766.398.846 1.316.738.686 1.094.203.720 27.616.739.005 3.506.183.435 7.771.450.085<br />
above 1990 levels 21 . This is the only sector of the economy to<br />
have seen such a large increase in emissions in this period:<br />
GHG emissions peaked around the beginning of the economic<br />
crisis and have shown unstable trends since, EU-wide as well<br />
as in CEE countries.<br />
Against this background, it is incomprehensible that CO 2<br />
emissions considerations are absent in transport planning<br />
and project selection. Such an approach contradicts the<br />
Commission’s target of a 60% reduction in greenhouse gas<br />
emissions from transport by 2050 22 . Meeting this target will<br />
require significant additional measures by CEE countries,<br />
and financing of sustainable mobility concepts should be<br />
prioritised above road construction. These measures include<br />
avoiding the use of transportation where possible, shifting<br />
necessary transport from environmentally-harmful modes<br />
to more environmentally-friendly modes and improving the<br />
efficiency of all modes of transport.<br />
20<br />
21<br />
22<br />
http://data.consilium.europa.eu/doc/document/ST-12790-2015-INIT/<br />
en/pdf<br />
http://www.eea.europa.eu/soer-2015/europe/transport<br />
http://ec.europa.eu/transport/themes/strategies/2011_white_paper_<br />
en.htm<br />
‘Climate’s enfants terribles: how new Member States’ misguided use of EU funds is holding back Europe’s clean energy transition’ 17