

ENFANTS TERRIBLES
enfants-terribles
enfants-terribles

You also want an ePaper? Increase the reach of your titles
YUMPU automatically turns print PDFs into web optimized ePapers that Google loves.
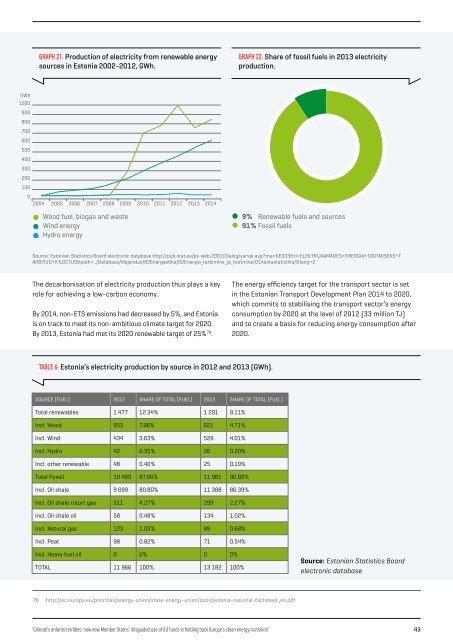
GRAPH 21: Production of electricity from renewable energy<br />
sources in Estonia 2002-2012, GWh.<br />
GRAPH 22: Share of fossil fuels in 2013 electricity<br />
production.<br />
GWh<br />
1000<br />
900<br />
800<br />
700<br />
600<br />
500<br />
400<br />
300<br />
200<br />
100<br />
0<br />
2004 2005 2006 2007 2008 2009 2010 2011 2012 2013 2014<br />
Wood fuel, biogas and waste<br />
Wind energy<br />
Hydro energy<br />
9% Renewable fuels and sources<br />
91% Fossil fuels<br />
Source: Estonian Statistics Board electronic database http://pub.stat.ee/px-web.2001/Dialog/varval.asp?ma=KE033&ti=ELEKTRIJAAMADES+ENERGIA+TOOTMISEKS+T<br />
ARBITUD+K%DCTUS&path=../Database/Majandus/02Energeetika/02Energia_tarbimine_ja_tootmine/01Aastastatistika/&lang=2<br />
The decarbonisation of electricity production thus plays a key<br />
role for achieving a low-carbon economy.<br />
By 2014, non-ETS emissions had decreased by 5%, and Estonia<br />
is on track to meet its non-ambitious climate target for 2020.<br />
By 2013, Estonia had met its 2020 renewable target of 25% 78 .<br />
The energy efficiency target for the transport sector is set<br />
in the Estonian Transport Development Plan 2014 to 2020,<br />
which commits to stabilising the transport sector’s energy<br />
consumption by 2020 at the level of 2012 (33 million TJ)<br />
and to create a basis for reducing energy consumption after<br />
2020.<br />
TABLE 6: Estonia’s electricity production by source in 2012 and 2013 (GWh).<br />
SOURCE (FUEL) 2012 SHARE OF TOTAL (FUEL) 2013 SHARE OF TOTAL (FUEL)<br />
Total renewables 1 477 12.34% 1 201 9.11%<br />
Incl. Wood 953 7.96% 621 4.71%<br />
Incl. Wind 434 3.63% 529 4.01%<br />
Incl. Hydro 42 0.35% 26 0.20%<br />
Incl. other renewable 48 0.40% 25 0.19%<br />
Total Fossil 10 489 87.66% 11 981 90.89%<br />
Incl. Oil shale 9 699 80.80% 11 388 86.39%<br />
Incl. Oil shale retort gas 511 4.27% 299 2.27%<br />
Incl. Oil shale oil 58 0.48% 134 1.02%<br />
Incl. Natural gas 123 1.03% 89 0.68%<br />
Incl. Peat 98 0.82% 71 0.54%<br />
Incl. Heavy fuel oil 0 0% 0 0%<br />
TOTAL 11 966 100% 13 182 100%<br />
Source: Estonian Statistics Board<br />
electronic database<br />
78<br />
http://ec.europa.eu/priorities/energy-union/state-energy-union/docs/estonia-national-factsheet_en.pdf<br />
‘Climate’s enfants terribles: how new Member States’ misguided use of EU funds is holding back Europe’s clean energy transition’ 43