Remaining Life of a Pipeline

You also want an ePaper? Increase the reach of your titles
YUMPU automatically turns print PDFs into web optimized ePapers that Google loves.
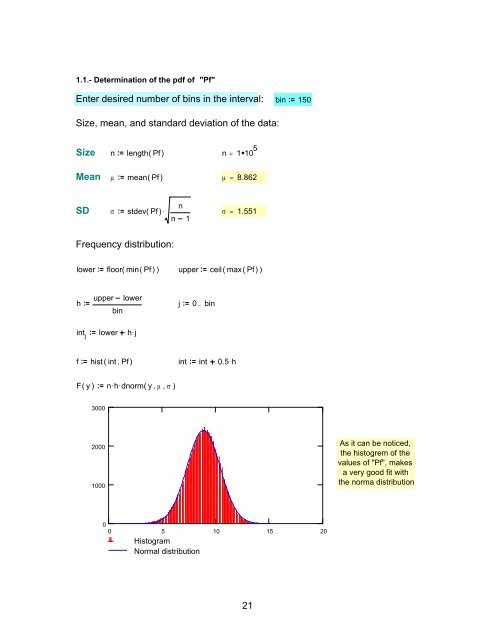
1.1.- Determination <strong>of</strong> the pdf <strong>of</strong> "Pf"<br />
Enter desired number <strong>of</strong> bins in the interval: bin 150<br />
Size, mean, and standard deviation <strong>of</strong> the data:<br />
Size n length( Pf ) n = 1 10 5<br />
Mean µ mean( Pf ) µ = 8.862<br />
n<br />
SD σ stdev( Pf ). σ = 1.551<br />
n 1<br />
Frequency distribution:<br />
lower<br />
floor( min( Pf )) upper ceil( max( Pf ))<br />
h<br />
upper<br />
bin<br />
lower<br />
j 0 .. bin<br />
int j<br />
lower h.<br />
j<br />
f<br />
hist ( int , Pf ) int int 0.5 . h<br />
F( y) n . h.<br />
dnorm( y , µ , σ )<br />
3000<br />
2000<br />
1000<br />
As it can be noticed,<br />
the histogrem <strong>of</strong> the<br />
values <strong>of</strong> "Pf", makes<br />
a very good fit with<br />
the norma distribution<br />
0<br />
0 5 10 15 20<br />
Histogram<br />
Normal distribution<br />
21