Remaining Life of a Pipeline

You also want an ePaper? Increase the reach of your titles
YUMPU automatically turns print PDFs into web optimized ePapers that Google loves.
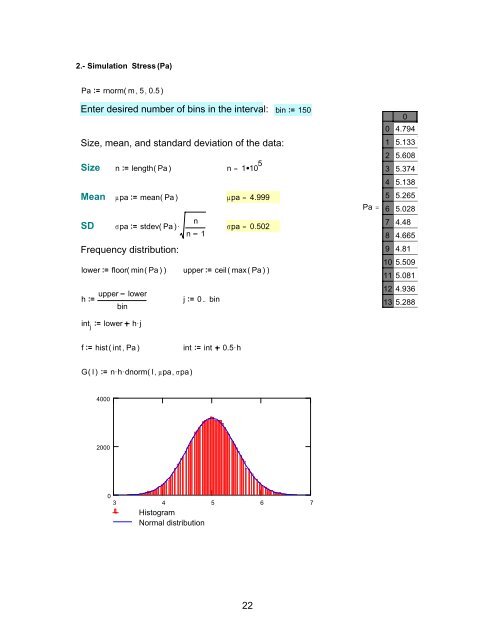
2.- Simulation Stress (Pa)<br />
Pa rnorm( m , 5 , 0.5 )<br />
Enter desired number <strong>of</strong> bins in the interval: bin 150<br />
Size, mean, and standard deviation <strong>of</strong> the data:<br />
Size n length( Pa ) n = 1 10 5<br />
0<br />
1<br />
2<br />
3<br />
0<br />
4.794<br />
5.133<br />
5.608<br />
5.374<br />
4<br />
5.138<br />
Mean µpa mean( Pa ) µpa = 4.999<br />
n<br />
SD σpa stdev( Pa ). σpa = 0.502<br />
n 1<br />
Frequency distribution:<br />
lower<br />
floor( min( Pa )) upper ceil( max( Pa ))<br />
Pa =<br />
5<br />
6<br />
7<br />
8<br />
9<br />
10<br />
11<br />
5.265<br />
5.028<br />
4.48<br />
4.665<br />
4.81<br />
5.509<br />
5.081<br />
h<br />
upper<br />
bin<br />
lower<br />
j 0 .. bin<br />
12<br />
13<br />
4.936<br />
5.288<br />
int j<br />
lower h.<br />
j<br />
f<br />
hist ( int , Pa ) int int 0.5 . h<br />
G( l) n . h.<br />
dnorm( l , µpa , σpa)<br />
4000<br />
2000<br />
0<br />
3 4 5 6 7<br />
Histogram<br />
Normal distribution<br />
22