EUROHEALTH
Eurohealth-volume22-number2-2016
Eurohealth-volume22-number2-2016

Create successful ePaper yourself
Turn your PDF publications into a flip-book with our unique Google optimized e-Paper software.
Moving towards universal health coverage<br />
25<br />
Population<br />
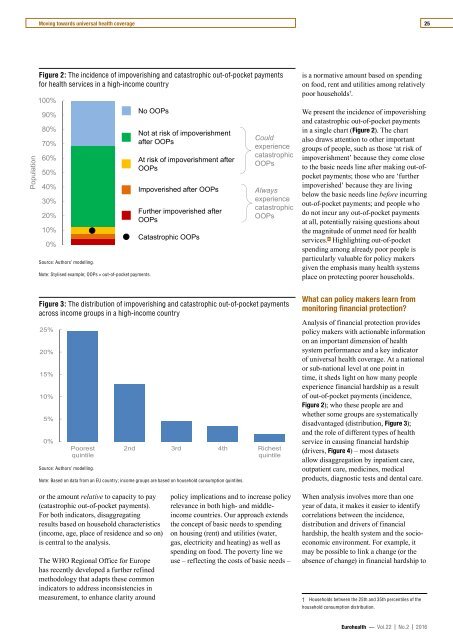
Figure 2: The incidence of impoverishing and catastrophic out-of-pocket payments<br />
for health services in a high-income country<br />
100%<br />
90%<br />
80%<br />
70%<br />
60%<br />
50%<br />
40%<br />
30%<br />
20%<br />
10%<br />
0%<br />
Source: Authors’ modelling.<br />
Note: Stylised example; OOPs = out-of-pocket payments.<br />
No OOPs<br />
Not at risk of impoverishment<br />
after OOPs<br />
At risk of impoverishment after<br />
OOPs<br />
Impoverished after OOPs<br />
Further impoverished after<br />
OOPs<br />
Catastrophic OOPs<br />
Could<br />
experience<br />
catastrophic<br />
OOPs<br />
Always<br />
experience<br />
catastrophic<br />
OOPs<br />
is a normative amount based on spending<br />
on food, rent and utilities among relatively<br />
poor households † .<br />
We present the incidence of impoverishing<br />
and catastrophic out-of-pocket payments<br />
in a single chart (Figure 2). The chart<br />
also draws attention to other important<br />
groups of people, such as those ‘at risk of<br />
impoverishment’ because they come close<br />
to the basic needs line after making out-ofpocket<br />
payments; those who are ‘further<br />
impoverished’ because they are living<br />
below the basic needs line before incurring<br />
out-of-pocket payments; and people who<br />
do not incur any out-of-pocket payments<br />
at all, potentially raising questions about<br />
the magnitude of unmet need for health<br />
services. 6 Highlighting out-of-pocket<br />
spending among already poor people is<br />
particularly valuable for policy makers<br />
given the emphasis many health systems<br />
place on protecting poorer households.<br />
Figure 3: The distribution of impoverishing and catastrophic out-of-pocket payments<br />
across income groups in a high-income country<br />
25%<br />
20%<br />
15%<br />
10%<br />
5%<br />
0%<br />
Poorest<br />
quintile<br />
Source: Authors’ modelling.<br />
2nd 3rd 4th Richest<br />
quintile<br />
Note: Based on data from an EU country; income groups are based on household consumption quintiles.<br />
What can policy makers learn from<br />
monitoring financial protection?<br />
Analysis of financial protection provides<br />
policy makers with actionable information<br />
on an important dimension of health<br />
system performance and a key indicator<br />
of universal health coverage. At a national<br />
or sub-national level at one point in<br />
time, it sheds light on how many people<br />
experience financial hardship as a result<br />
of out-of-pocket payments (incidence,<br />
Figure 2); who these people are and<br />
whether some groups are systematically<br />
disadvantaged (distribution, Figure 3);<br />
and the role of different types of health<br />
service in causing financial hardship<br />
(drivers, Figure 4) – most datasets<br />
allow disaggregation by inpatient care,<br />
outpatient care, medicines, medical<br />
products, diagnostic tests and dental care.<br />
or the amount relative to capacity to pay<br />
(catastrophic out-of-pocket payments).<br />
For both indicators, disaggregating<br />
results based on household characteristics<br />
(income, age, place of residence and so on)<br />
is central to the analysis.<br />
The WHO Regional Office for Europe<br />
has recently developed a further refined<br />
methodology that adapts these common<br />
indicators to address inconsistencies in<br />
measurement, to enhance clarity around<br />
policy implications and to increase policy<br />
relevance in both high- and middleincome<br />
countries. Our approach extends<br />
the concept of basic needs to spending<br />
on housing (rent) and utilities (water,<br />
gas, electricity and heating) as well as<br />
spending on food. The poverty line we<br />
use – reflecting the costs of basic needs –<br />
When analysis involves more than one<br />
year of data, it makes it easier to identify<br />
correlations between the incidence,<br />
distribution and drivers of financial<br />
hardship, the health system and the socioeconomic<br />
environment. For example, it<br />
may be possible to link a change (or the<br />
absence of change) in financial hardship to<br />
† Households between the 25th and 35th percentiles of the<br />
household consumption distribution.<br />
Eurohealth — Vol.22 | No.2 | 2016