

Reinventing Manufacturing
eayWVRd
eayWVRd

Create successful ePaper yourself
Turn your PDF publications into a flip-book with our unique Google optimized e-Paper software.
<strong>Reinventing</strong> <strong>Manufacturing</strong><br />
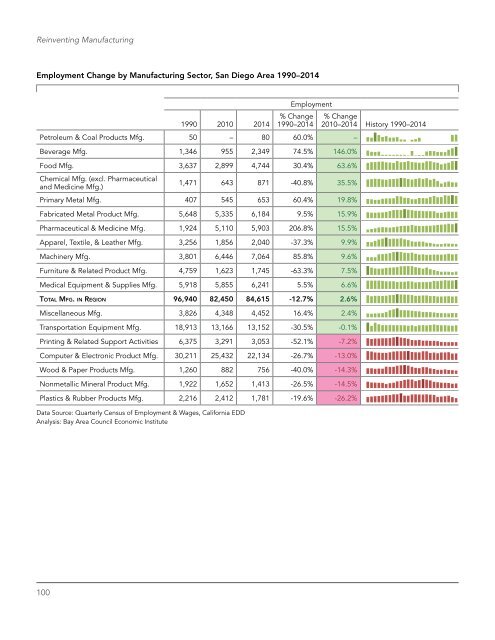
Employment Change by <strong>Manufacturing</strong> Sector, San Diego Area 1990–2014<br />
1990 2010 2014<br />
Employment<br />
% Change<br />
1990–2014<br />
Petroleum & Coal Products Mfg. 50 – 80 60.0% –<br />
Beverage Mfg. 1,346 955 2,349 74.5% 146.0%<br />
Food Mfg. 3,637 2,899 4,744 30.4% 63.6%<br />
Chemical Mfg. (excl. Pharmaceutical<br />
and Medicine Mfg.)<br />
1,471 643 871 -40.8% 35.5%<br />
Primary Metal Mfg. 407 545 653 60.4% 19.8%<br />
Fabricated Metal Product Mfg. 5,648 5,335 6,184 9.5% 15.9%<br />
Pharmaceutical & Medicine Mfg. 1,924 5,110 5,903 206.8% 15.5%<br />
Apparel, Textile, & Leather Mfg. 3,256 1,856 2,040 -37.3% 9.9%<br />
Machinery Mfg. 3,801 6,446 7,064 85.8% 9.6%<br />
Furniture & Related Product Mfg. 4,759 1,623 1,745 -63.3% 7.5%<br />
Medical Equipment & Supplies Mfg. 5,918 5,855 6,241 5.5% 6.6%<br />
Total Mfg. in Region 96,940 82,450 84,615 -12.7% 2.6%<br />
Miscellaneous Mfg. 3,826 4,348 4,452 16.4% 2.4%<br />
Transportation Equipment Mfg. 18,913 13,166 13,152 -30.5% -0.1%<br />
Printing & Related Support Activities 6,375 3,291 3,053 -52.1% -7.2%<br />
Computer & Electronic Product Mfg. 30,211 25,432 22,134 -26.7% -13.0%<br />
Wood & Paper Products Mfg. 1,260 882 756 -40.0% -14.3%<br />
Nonmetallic Mineral Product Mfg. 1,922 1,652 1,413 -26.5% -14.5%<br />
Plastics & Rubber Products Mfg. 2,216 2,412 1,781 -19.6% -26.2%<br />
Data Source: Quarterly Census of Employment & Wages, California EDD<br />
Analysis: Bay Area Council Economic Institute<br />
% Change<br />
2010–2014 History 1990–2014<br />
100