

Reinventing Manufacturing
eayWVRd
eayWVRd

Create successful ePaper yourself
Turn your PDF publications into a flip-book with our unique Google optimized e-Paper software.
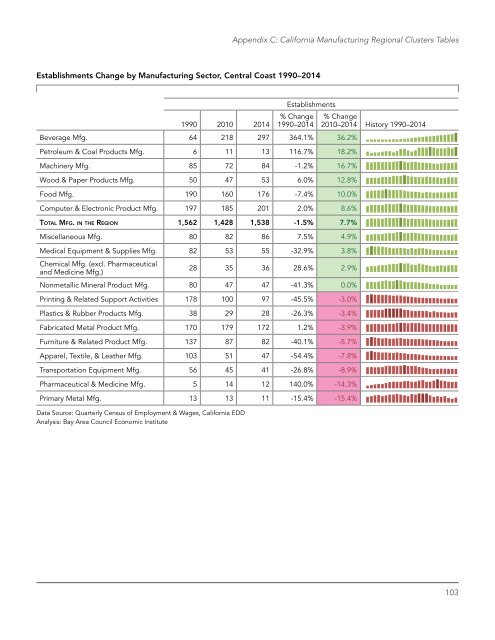
Appendix C: California <strong>Manufacturing</strong> Regional Clusters Tables<br />
Establishments Change by <strong>Manufacturing</strong> Sector, Central Coast 1990–2014<br />
1990 2010 2014<br />
Establishments<br />
% Change<br />
1990–2014<br />
Beverage Mfg. 64 218 297 364.1% 36.2%<br />
Petroleum & Coal Products Mfg. 6 11 13 116.7% 18.2%<br />
Machinery Mfg. 85 72 84 -1.2% 16.7%<br />
Wood & Paper Products Mfg. 50 47 53 6.0% 12.8%<br />
Food Mfg. 190 160 176 -7.4% 10.0%<br />
Computer & Electronic Product Mfg. 197 185 201 2.0% 8.6%<br />
Total Mfg. in the Region 1,562 1,428 1,538 -1.5% 7.7%<br />
Miscellaneous Mfg. 80 82 86 7.5% 4.9%<br />
Medical Equipment & Supplies Mfg. 82 53 55 -32.9% 3.8%<br />
Chemical Mfg. (excl. Pharmaceutical<br />
and Medicine Mfg.)<br />
28 35 36 28.6% 2.9%<br />
Nonmetallic Mineral Product Mfg. 80 47 47 -41.3% 0.0%<br />
Printing & Related Support Activities 178 100 97 -45.5% -3.0%<br />
Plastics & Rubber Products Mfg. 38 29 28 -26.3% -3.4%<br />
Fabricated Metal Product Mfg. 170 179 172 1.2% -3.9%<br />
Furniture & Related Product Mfg. 137 87 82 -40.1% -5.7%<br />
Apparel, Textile, & Leather Mfg. 103 51 47 -54.4% -7.8%<br />
Transportation Equipment Mfg. 56 45 41 -26.8% -8.9%<br />
Pharmaceutical & Medicine Mfg. 5 14 12 140.0% -14.3%<br />
Primary Metal Mfg. 13 13 11 -15.4% -15.4%<br />
Data Source: Quarterly Census of Employment & Wages, California EDD<br />
Analysis: Bay Area Council Economic Institute<br />
% Change<br />
2010–2014 History 1990–2014<br />
103