

Reinventing Manufacturing
eayWVRd
eayWVRd

You also want an ePaper? Increase the reach of your titles
YUMPU automatically turns print PDFs into web optimized ePapers that Google loves.
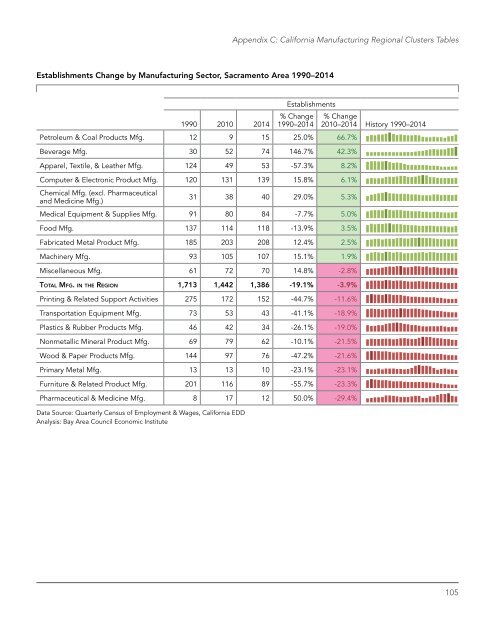
Appendix C: California <strong>Manufacturing</strong> Regional Clusters Tables<br />
Establishments Change by <strong>Manufacturing</strong> Sector, Sacramento Area 1990–2014<br />
1990 2010 2014<br />
Establishments<br />
% Change<br />
1990–2014<br />
Petroleum & Coal Products Mfg. 12 9 15 25.0% 66.7%<br />
Beverage Mfg. 30 52 74 146.7% 42.3%<br />
Apparel, Textile, & Leather Mfg. 124 49 53 -57.3% 8.2%<br />
Computer & Electronic Product Mfg. 120 131 139 15.8% 6.1%<br />
Chemical Mfg. (excl. Pharmaceutical<br />
and Medicine Mfg.)<br />
31 38 40 29.0% 5.3%<br />
Medical Equipment & Supplies Mfg. 91 80 84 -7.7% 5.0%<br />
Food Mfg. 137 114 118 -13.9% 3.5%<br />
Fabricated Metal Product Mfg. 185 203 208 12.4% 2.5%<br />
Machinery Mfg. 93 105 107 15.1% 1.9%<br />
Miscellaneous Mfg. 61 72 70 14.8% -2.8%<br />
Total Mfg. in the Region 1,713 1,442 1,386 -19.1% -3.9%<br />
Printing & Related Support Activities 275 172 152 -44.7% -11.6%<br />
Transportation Equipment Mfg. 73 53 43 -41.1% -18.9%<br />
Plastics & Rubber Products Mfg. 46 42 34 -26.1% -19.0%<br />
Nonmetallic Mineral Product Mfg. 69 79 62 -10.1% -21.5%<br />
Wood & Paper Products Mfg. 144 97 76 -47.2% -21.6%<br />
Primary Metal Mfg. 13 13 10 -23.1% -23.1%<br />
Furniture & Related Product Mfg. 201 116 89 -55.7% -23.3%<br />
Pharmaceutical & Medicine Mfg. 8 17 12 50.0% -29.4%<br />
Data Source: Quarterly Census of Employment & Wages, California EDD<br />
Analysis: Bay Area Council Economic Institute<br />
% Change<br />
2010–2014 History 1990–2014<br />
105