

Reinventing Manufacturing
eayWVRd
eayWVRd

Create successful ePaper yourself
Turn your PDF publications into a flip-book with our unique Google optimized e-Paper software.
California’s Shifting Landscape: <strong>Manufacturing</strong> and the Innovation Ecosystem<br />
Patent Activity<br />
Patents registered to California inventors represented<br />
approximately 10 percent of total US patent registrations<br />
in 2013. A total of 36,193 patents were registered<br />
to primary inventors located in California; this number<br />
has increased by a factor of four since 1990. Thirty-one<br />
percent of those patents are registered in the Computers,<br />
Data Processing, and Information Storage field,<br />
which has produced an average annual growth rate of<br />
15.2 percent. This category includes computer hardware<br />
as well as code and methodology for data processing<br />
and storage. Other sectors have also grown quickly,<br />
including Communications and Health, which have<br />
experienced annual growth rates of 13.5 percent and<br />
9.4 percent, respectively. The number of Transportation/<br />
Vehicles patents, another high growth area in manufacturing,<br />
has also been rising. Together, these four categories<br />
made up nearly three-quarters of the state’s patent<br />
activity in 2013.<br />
California’s patent registration growth relates closely<br />
to the state’s strong manufacturing activity. California<br />
ranks second (following Michigan) in the number of<br />
patent registrations in the category of <strong>Manufacturing</strong>,<br />
Assembling, & Treating. While overall patent registrations<br />
within California in this category declined by more<br />
than 40 percent between 2006 and 2009 (in line with a<br />
broader downturn in patent activity), patent registrations<br />
began to ramp back up starting in 2010.<br />
California’s patent activity is highly concentrated in the<br />
Bay Area. With 153,436 registered patents, or 61.3<br />
percent of all California patent activity, the Bay Area<br />
has registered more patents between 2004 and 2013<br />
than all other regions combined. This large share of<br />
patents in the Bay Area is due to the region’s specialization<br />
in the largest seven patent categories in the state.<br />
No other single region has registered more than half of<br />
the patents in any category, but other regions do show<br />
pockets of concentration.<br />
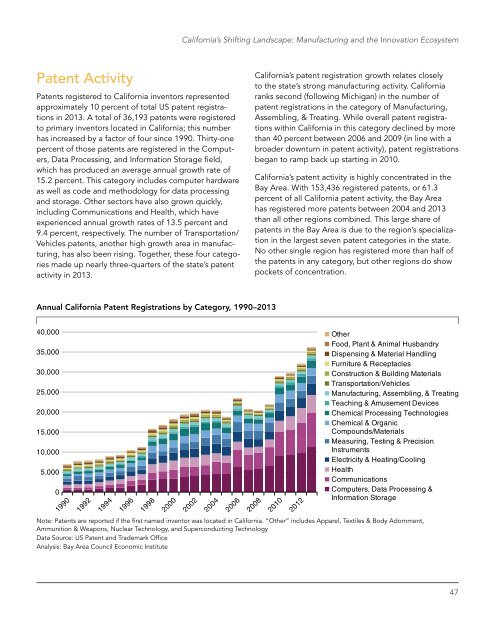
Annual California Patent Registrations by Category, 1990–2013<br />
40,000 Other<br />
Food, Plant & Animal Husbandry<br />
35,000<br />
Dispensing & Material Handling<br />
Furniture & Receptacles<br />
30,000<br />
Construction & Building Materials<br />
Transportation/Vehicles<br />
25,000<br />
<strong>Manufacturing</strong>, Assembling, & Treating<br />
Teaching & Amusement Devices<br />
20,000<br />
Chemical Processing Technologies<br />
Chemical & Organic<br />
15,000<br />
Compounds/Materials<br />
Measuring, Testing & Precision<br />
10,000<br />
Instruments<br />
Electricity & Heating/Cooling<br />
5,000<br />
Health<br />
Communications<br />
0<br />
Computers, Data Processing &<br />
Information Storage<br />
Note: Patents are reported if the first named inventor was located in California. “Other” includes Apparel, Textiles & Body Adornment,<br />
Ammunition & Weapons, Nuclear Technology, and Superconducting Technology<br />
Data Source: US Patent and Trademark Office<br />
Analysis: Bay Area Council Economic Institute<br />
47