

Reinventing Manufacturing
eayWVRd
eayWVRd

Create successful ePaper yourself
Turn your PDF publications into a flip-book with our unique Google optimized e-Paper software.
California’s Shifting Landscape: <strong>Manufacturing</strong> and the Innovation Ecosystem<br />
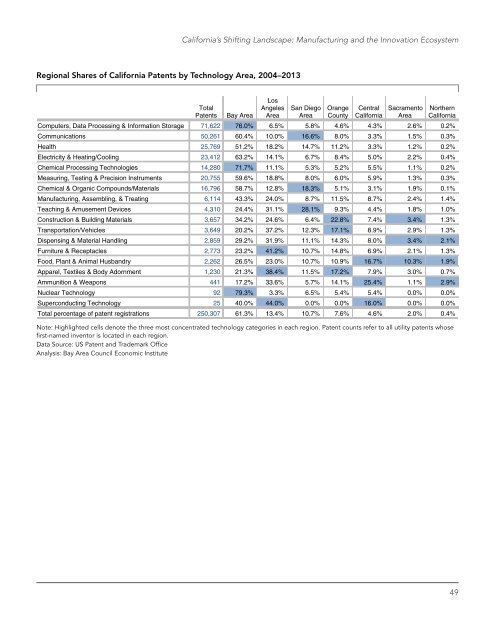
Regional Shares of California Patents by Technology Area, 2004–2013<br />
Total<br />
Patents<br />
Bay Area<br />
Los<br />
Angeles<br />
Area<br />
San Diego<br />
Area<br />
Orange<br />
County<br />
Central<br />
California<br />
Sacramento<br />
Area<br />
Northern<br />
California<br />
Computers, Data Processing & Information Storage<br />
Communications<br />
Health<br />
Electricity & Heating/Cooling<br />
Chemical Processing Technologies<br />
Measuring, Testing & Precision Instruments<br />
Chemical & Organic Compounds/Materials<br />
<strong>Manufacturing</strong>, Assembling, & Treating<br />
Teaching & Amusement Devices<br />
Construction & Building Materials<br />
Transportation/Vehicles<br />
Dispensing & Material Handling<br />
Furniture & Receptacles<br />
Food, Plant & Animal Husbandry<br />
Apparel, Textiles & Body Adornment<br />
Ammunition & Weapons<br />
Nuclear Technology<br />
Superconducting Technology<br />
Total percentage of patent registrations<br />
71,622<br />
50,261<br />
25,769<br />
23,412<br />
14,280<br />
20,755<br />
16,796<br />
6,114<br />
4,310<br />
3,657<br />
3,649<br />
2,859<br />
2,773<br />
2,262<br />
1,230<br />
441<br />
92<br />
25<br />
250,307<br />
76.0%<br />
60.4%<br />
51.2%<br />
63.2%<br />
71.7%<br />
59.6%<br />
58.7%<br />
43.3%<br />
24.4%<br />
34.2%<br />
20.2%<br />
29.2%<br />
23.2%<br />
26.5%<br />
21.3%<br />
17.2%<br />
79.3%<br />
40.0%<br />
61.3%<br />
6.5%<br />
10.0%<br />
18.2%<br />
14.1%<br />
11.1%<br />
18.8%<br />
12.8%<br />
24.0%<br />
31.1%<br />
24.6%<br />
37.2%<br />
31.9%<br />
41.2%<br />
23.0%<br />
38.4%<br />
33.6%<br />
3.3%<br />
44.0%<br />
13.4%<br />
5.8%<br />
16.6%<br />
14.7%<br />
6.7%<br />
5.3%<br />
8.0%<br />
18.3%<br />
8.7%<br />
28.1%<br />
6.4%<br />
12.3%<br />
11.1%<br />
10.7%<br />
10.7%<br />
11.5%<br />
5.7%<br />
6.5%<br />
0.0%<br />
10.7%<br />
4.6%<br />
8.0%<br />
11.2%<br />
8.4%<br />
5.2%<br />
6.0%<br />
5.1%<br />
11.5%<br />
9.3%<br />
22.8%<br />
17.1%<br />
14.3%<br />
14.8%<br />
10.9%<br />
17.2%<br />
14.1%<br />
5.4%<br />
0.0%<br />
7.6%<br />
4.3%<br />
3.3%<br />
3.3%<br />
5.0%<br />
5.5%<br />
5.9%<br />
3.1%<br />
8.7%<br />
4.4%<br />
7.4%<br />
8.9%<br />
8.0%<br />
6.9%<br />
16.7%<br />
7.9%<br />
25.4%<br />
5.4%<br />
16.0%<br />
4.6%<br />
2.6%<br />
1.5%<br />
1.2%<br />
2.2%<br />
1.1%<br />
1.3%<br />
1.9%<br />
2.4%<br />
1.8%<br />
3.4%<br />
2.9%<br />
3.4%<br />
2.1%<br />
10.3%<br />
3.0%<br />
1.1%<br />
0.0%<br />
0.0%<br />
2.0%<br />
0.2%<br />
0.3%<br />
0.2%<br />
0.4%<br />
0.2%<br />
0.3%<br />
0.1%<br />
1.4%<br />
1.0%<br />
1.3%<br />
1.3%<br />
2.1%<br />
1.3%<br />
1.9%<br />
0.7%<br />
2.9%<br />
0.0%<br />
0.0%<br />
0.4%<br />
Note: Highlighted cells denote the three most concentrated technology categories in each region. Patent counts refer to all utility patents whose<br />
first-named inventor is located in each region.<br />
Data Source: US Patent and Trademark Office<br />
Analysis: Bay Area Council Economic Institute<br />
49