- Page 1 and 2:
CQG Integrated Client Charting and
- Page 3 and 4:
Table of Contents Charting and Stud
- Page 5 and 6:
Fibonacci Time Retracement (FiboTR)
- Page 7 and 8:
Triple Exponential (Trix) .........
- Page 9 and 10:
Charting and Studies in CQG IC Page
- Page 11 and 12:
CQG Charts Page 3 CQG provides a nu
- Page 13 and 14:
Bars The bar display changes depend
- Page 15 and 16:
Scroll buttons These buttons allow
- Page 17:
Using Charts in Training Mode Page
- Page 20 and 21:
Page 12 Setting Main Preferences On
- Page 22 and 23:
Page 14 To change the session type
- Page 24 and 25:
Page 16 From the Custom Sessions wi
- Page 26 and 27:
Page 18 Setting Miscellaneous Prefe
- Page 28 and 29:
Page 20 Preference Description Rese
- Page 30 and 31:
Page 22 Type Description Selecting
- Page 32 and 33:
Page 24 Setting Bond Continuation P
- Page 34 and 35:
Page 26 Setting CID Preferences CID
- Page 36 and 37:
Page 28 Select Grid Display Setting
- Page 38 and 39:
Page 30 Set Time Shading Select the
- Page 40 and 41:
Page 32 If you want to change the r
- Page 42 and 43:
Page 34 Setting Labels and Values P
- Page 44 and 45:
Page 36 Study Titles Study titles a
- Page 46 and 47:
Page 38 Display the Order Book The
- Page 48 and 49:
Page 40 Common Parameters Some char
- Page 51 and 52:
Chart Types Page 43 CQG offers over
- Page 53 and 54:
Bar Parameters • Color • MarkIt
- Page 55 and 56:
Page 47 In the FX market, the Aband
- Page 57 and 58:
Page 49 A constant volume chart may
- Page 59 and 60:
Constant Volume Bars Parameters •
- Page 61 and 62:
Equalize Sessions Parameters • Co
- Page 63 and 64:
Line (Line) Page 55 Connects succes
- Page 65 and 66:
Market Profile (MP) Page 57 Market
- Page 67 and 68:
TPO Time TPO US CST Time K 1300 k 1
- Page 69 and 70:
Markers and Indicators Page 61 Init
- Page 71 and 72:
Page 63 Right-click the volume, and
- Page 73 and 74:
Market Profile Toolbar The Market P
- Page 75 and 76:
Changing the Price Scale Page 67 CQ
- Page 77 and 78:
Changing TPO Distribution Profiles
- Page 79 and 80:
To display distributions by session
- Page 81 and 82:
Page 73 To remove the splits in thi
- Page 83 and 84:
No Gap Parameters • Display • R
- Page 85 and 86:
Percent Bar Parameters • Color
- Page 87 and 88:
No Xs or Os are displayed if prices
- Page 89 and 90:
Page 81 • One Step Back: Tells th
- Page 91 and 92:
Spread Bar (SprdBar) Spread bar ret
- Page 93 and 94:
TFlow (TFlow) Page 85 TFlow offers
- Page 95 and 96:
TFlow Outputs Page 87 The cursor va
- Page 97 and 98:
Time-Based TFlow Outputs Page 89 Th
- Page 99 and 100:
Tick (Tick) Tick charts display eac
- Page 101 and 102:
Tick Chart Smoothing (TCS) Page 93
- Page 103 and 104:
Tick Chart Smoothing Outputs • Op
- Page 105 and 106:
Yield Parameters • Color • Mark
- Page 107 and 108:
Simple Bond Page 99 The concept of
- Page 109 and 110:
Moosmuller Page 101 The Moosmuller
- Page 111 and 112:
Working with Charts Page 103 Entry
- Page 113 and 114:
Shortcut Opens symbol,M monthly cha
- Page 115 and 116:
Embedded Errors Chart-specific resp
- Page 117 and 118:
Changing the Chart Type, Interval,
- Page 119 and 120:
To change the symbol Type a symbol
- Page 121 and 122:
To share grids between charts Page
- Page 123 and 124:
To use logarithmic or linear scale
- Page 125 and 126:
Time Scale Click and drag the price
- Page 127 and 128:
To set default spacing 1. Move the
- Page 129 and 130:
To use global cursors Page 121 This
- Page 131 and 132:
To set Price X Line alerts 1. Add a
- Page 133 and 134:
Page 125 Note that if the contracts
- Page 135 and 136:
Page 127 Charting and Studies User
- Page 137 and 138:
1. Click the Setup button. 2. Click
- Page 139 and 140:
Trading on a Chart Page 131 CQG off
- Page 141 and 142:
Order Book The Order Book displays
- Page 143 and 144:
Trading on a Chart with SnapTrader
- Page 145 and 146:
To place a market order Click or to
- Page 147 and 148:
To return to current best bid and a
- Page 149 and 150:
Trading on a Chart with Studies Pag
- Page 151 and 152:
Forward and Yield Curves Page 143 T
- Page 153 and 154:
Opening the Forward Curve or Yield
- Page 155 and 156:
The Curve Toolbar The toolbar for f
- Page 157 and 158:
To move across the instruments 1. C
- Page 159 and 160:
To change instrument 1. Right-click
- Page 161 and 162:
Working with Portfolios Page 153 Th
- Page 163 and 164:
Working with Curves Page 155 You ca
- Page 165 and 166:
Setting Forward and Yield Curve Pre
- Page 167 and 168:
Pointer Tools Page 159 Many pointer
- Page 169 and 170:
Parameters $1:1 = entry point of fi
- Page 171 and 172:
Parameters CF1:1 = the center point
- Page 173 and 174:
Eraser (Eras) What it does: Deletes
- Page 175 and 176:
Parameters FC1:FC1 = circle of orig
- Page 177 and 178:
Parameters Page 169 • FE1 Value:
- Page 179 and 180:
Parameters Page 171 • Value: Sele
- Page 181 and 182:
Parameters • Date: Defines the da
- Page 183 and 184:
Parameters • Color • Weight •
- Page 185 and 186:
How to use it: Parameters 1. Select
- Page 187 and 188:
Linear Regression (LinR) What it do
- Page 189 and 190:
Parameters • Display Page 181 •
- Page 191 and 192:
Parameters Page 183 • PFork 1 Val
- Page 193 and 194:
Profile Area What it does: Page 185
- Page 195 and 196:
• Calculate On: Select Price or V
- Page 197 and 198:
Speed Lines (SpdLin) What it does:
- Page 199 and 200:
Text (Text) What it does: Page 191
- Page 201 and 202:
Parameters Txt1: text = the text as
- Page 203 and 204:
To display the angle of the trend l
- Page 205 and 206:
Add a trend line to another pointer
- Page 207 and 208:
Parameters • Value: Allows the us
- Page 209 and 210:
Zoom (Zoom) What it does: Page 201
- Page 211 and 212:
Undo Zoom (UnZm) What it does: Page
- Page 213 and 214:
To remove Pointer Tools Page 205 Th
- Page 215 and 216:
To adjust pointer tools Page 207 1.
- Page 217 and 218:
Basic Studies Page 209 CQG offers a
- Page 219 and 220:
Accumulative Swing Index (ASI) Page
- Page 221 and 222:
Adaptive Moving Average (AMA) Page
- Page 223 and 224:
Aroon Oscillator (AroonOSC) Page 21
- Page 225 and 226:
Aroon Oscillator Parameters • Dis
- Page 227 and 228:
Average True Range (ATR) Page 219 T
- Page 229 and 230:
BarXData Parameters • Color • M
- Page 231 and 232:
Bollinger Band Parameters • Displ
- Page 233 and 234:
Bollinger Band Difference Parameter
- Page 235 and 236:
CVBXData Parameters • Display •
- Page 237 and 238:
Harami Bearish (HI) Harami Bullish
- Page 239 and 240:
Engulfing Bullish Page 231 The Engu
- Page 241 and 242:
Morning Star Page 233 The Morning S
- Page 243 and 244:
Candlestick Formation Parameters
- Page 245 and 246:
Channel Parameters Set parameters f
- Page 247 and 248:
To overlay charts Page 239 Overlayi
- Page 249 and 250:
Other Chart Overlay Actions • To
- Page 251 and 252:
Commodity Channel Index (CCI) Page
- Page 253 and 254:
Congestion Count (ConCnt) Page 245
- Page 255 and 256:
Delta Contours (Delta) All options
- Page 257 and 258:
• Params Model: Choose model. Opt
- Page 259 and 260:
Directional Movement Index Paramete
- Page 261 and 262:
DMI Difference Parameters • Displ
- Page 263 and 264:
Page 255 reversal. In any case, the
- Page 265 and 266:
• Display: Page 257 Peak Sync: Wh
- Page 267 and 268:
Envelope Parameters • Display Pag
- Page 269 and 270:
Data file format The ASCII file mus
- Page 271 and 272:
Fancy On Balance Volume (FOBV) Page
- Page 273 and 274:
Fancy On Balance Volume Parameters
- Page 275 and 276:
Fast Stochastics Parameters • Dis
- Page 277 and 278:
Standard Deviation: See Standard De
- Page 279 and 280:
Page 271 Imoku:3 (MaxPer(High, Peri
- Page 281 and 282:
Implied Volatility (ImpVol) Page 27
- Page 283 and 284:
Symbol MinDE MaxDE ODR SR MinTicks
- Page 285 and 286:
Symbol MinDE MaxDE ODR SR MinTicks
- Page 287 and 288:
Keltner Channel Parameters • Disp
- Page 289 and 290:
Details of MPVA Calculation Page 28
- Page 291 and 292:
Market Profile Value Areas Paramete
- Page 293 and 294:
Missing Bar Count (MBCnt) This stud
- Page 295 and 296:
Momentum (Mom) Page 287 The Momentu
- Page 297 and 298:
Page 289 unable to track an extende
- Page 299 and 300:
The formula for calculating the ESM
- Page 301 and 302:
Moving Average Convergence/Divergen
- Page 303 and 304:
Moving Average Convergence Divergen
- Page 305 and 306:
Moving Average Cross Parameters •
- Page 307 and 308:
Page 299 different when in real-tim
- Page 309 and 310:
Moving Linear Regression R Squared
- Page 311 and 312:
On Balance Volume (OBV) Page 303 On
- Page 313 and 314:
Open Interest (OI) Page 305 The Ope
- Page 315 and 316:
Oscillator (Osc) Page 307 The Oscil
- Page 317 and 318:
Oscillator Cross (OSCx) Page 309 Th
- Page 319 and 320:
Oscillator - MA of Oscillator (OsMA
- Page 321 and 322:
Parabolic Outputs • Para: Value o
- Page 323 and 324:
%R Parameters • Display • MarkI
- Page 325 and 326:
Rank Parameters • Display • Mar
- Page 327 and 328:
Page 319 ROC, like other oscillator
- Page 329 and 330:
Relative Strength Index (RSI) Page
- Page 331 and 332:
Reversal (Rev) Page 323 Measures th
- Page 333 and 334:
Slow Stochastics (SStoch) Page 325
- Page 335 and 336:
Tick Volume (TckVol) Page 327 Tick
- Page 337 and 338:
TFlow External Data (TFXData) Page
- Page 339 and 340:
TFlow On Balance Volume (TFOBV) Pag
- Page 341 and 342:
Triple Exponential Parameters • D
- Page 343 and 344:
Volatility Stop (VolStp) Page 335 T
- Page 345 and 346:
Volatility System (VolSys) Page 337
- Page 347 and 348:
Volume (Vol) This study displays ac
- Page 349 and 350:
Volume Calculation Trade volume is
- Page 351 and 352:
Volume Profile (VP) Page 343 The Vo
- Page 353 and 354:
Volume and Open Interest (VolOI) Pa
- Page 355 and 356:
Volume and Open Interest Parameters
- Page 357 and 358:
ZigZag (ZZ) Page 349 The ZigZag stu
- Page 359 and 360:
Pre-Trade Studies DOMActivity (DmAc
- Page 361 and 362:
DOMTracker Oscillator (DmTrOsc) Thi
- Page 363 and 364:
Trading Studies Page 355 This set o
- Page 365 and 366:
Open Trade Equity (OTE) The OTE stu
- Page 367 and 368:
Order Display (OrderDis) The Order
- Page 369 and 370:
Order Display Parameters Parameters
- Page 371 and 372:
To modify study parameters 1. Right
- Page 373 and 374:
Position Parameters • Display •
- Page 375:
Profit & Loss Parameters • Displa
- Page 378 and 379:
Page 370 Adding Study Buttons to th
- Page 380 and 381:
Page 372 To clear study buttons fro
- Page 382 and 383:
Page 374 To add a study to a chart
- Page 384 and 385:
Page 376 There are several ways to
- Page 386 and 387:
Page 378 The DOM will display squar
- Page 388 and 389:
Page 380 To remove study values Rig
- Page 390 and 391:
Page 382 Adding Conditions to a Cha
- Page 392 and 393:
Page 384 To create a custom conditi
- Page 394 and 395:
Page 386 To set an alert from a con
- Page 396 and 397:
Page 388 4. Click Include. To add e
- Page 398 and 399:
Page 390 Opening the Instrument Mon
- Page 400 and 401:
Page 392 Instrument Monitor Compone
- Page 402 and 403:
Page 394 Chart types The right pane
- Page 404 and 405:
Page 396 Title bar The monitor titl
- Page 406 and 407:
Page 398 Watch List The watch list
- Page 408 and 409:
Page 400 X Global Click this button
- Page 410 and 411:
Page 402 Price values Choose whethe
- Page 412 and 413:
Page 404 Setting Trading Display Pr
- Page 414 and 415:
Page 406 Setting Portfolio Monitor
- Page 416 and 417:
Page 408 Setting Basic Formatting P
- Page 418 and 419:
Page 410 Setting Histogram Paramete
- Page 420 and 421:
Page 412 Setting Child Row Coloring
- Page 422 and 423:
Page 414 To add a tab to the monito
- Page 424 and 425:
Page 416 Working with Studies and C
- Page 426 and 427:
Page 418 To add conditions You can
- Page 428 and 429:
Page 420 Working with Chart Columns
- Page 430 and 431:
Page 422 To cut, copy, and paste 1.
- Page 432 and 433:
Page 424 Working with Chart and Stu
- Page 434 and 435:
Page 426 To modify a study 1. Right
- Page 436 and 437:
Page 428 To hide or show columns 1.
- Page 438 and 439:
Page 430 To create, edit, and delet
- Page 440 and 441:
Page 432 The watch list is displaye
- Page 442 and 443:
Page 434 Trading Column Description
- Page 444 and 445:
Page 436 Column Image Description W
- Page 446 and 447:
Page 438 To add, remove, and move t
- Page 448 and 449:
Page 440 To modify and cancel order
- Page 451 and 452:
Third-Party Studies CQG offers many
- Page 453 and 454:
Display Parameter Display parameter
- Page 455:
OB/OS Parameter These parameters ap
- Page 458 and 459:
Page 450 Add on Alert (atmAoA) AoA
- Page 460 and 461:
Page 452 Direction Speed Indicator
- Page 462 and 463:
Page 454 First Alert (atmFA) The Fi
- Page 464 and 465:
Page 456 Major Wave Oscillator (atm
- Page 466 and 467:
Page 458 Possible Turning Point (at
- Page 468 and 469:
Page 460 Support and Resistance Ban
- Page 470 and 471:
Page 462 Trader Alert (atmTA) The A
- Page 472 and 473:
Page 464 Trend Direction Indicator
- Page 474 and 475:
Page 466 Trend Strength Indicator (
- Page 476 and 477:
Page 468 Umbrella (atmUmb) The ATM
- Page 479 and 480:
DiNapoli Studies Page 471 The DiNap
- Page 481 and 482:
Retracement (DNRetr) Page 473 DiNap
- Page 483 and 484:
Expansion (DNExp) CQG calculates an
- Page 485 and 486:
Profitunity Studies Page 477 Since
- Page 487 and 488:
Awesome Oscillator (AweO) Page 479
- Page 489 and 490:
BW All Studies (BWAll) Applies all
- Page 491 and 492:
BW AO (BWAO) Page 483 Investors can
- Page 493 and 494:
BW Zone Trade (BWZT) Page 485 The Z
- Page 495 and 496:
Blue Light (BluLite) The Blue Light
- Page 497 and 498:
Super Awesome Oscillator (SuperAO)
- Page 499 and 500:
Shaun Downey Studies Page 491 Benef
- Page 501 and 502:
HiLoCnt Parameters Name Default Def
- Page 503 and 504:
Interpretation Page 495 The thresho
- Page 505 and 506:
PRHLCnt Parameters Name Default Def
- Page 507 and 508: Interpretation Page 499 The thresho
- Page 509 and 510: PVHLCnt Parameters Display Paramete
- Page 511 and 512: Page 503 It appears on the chart as
- Page 513 and 514: Time Average Bands (TAvBand) Page 5
- Page 515 and 516: TAvBand Parameters Name Default Def
- Page 517 and 518: Philosophy Page 509 Volatility Time
- Page 519 and 520: ADX Steps (AdxStep) Philosophy Page
- Page 521 and 522: CCI Steps (CciStep) Philosophy Page
- Page 523 and 524: CciStep Parameters Name Default Def
- Page 525 and 526: HVOL Steps (HvlStep) Philosophy Thi
- Page 527 and 528: Page 519 Bonds will also rarely ext
- Page 529 and 530: Page 521 intraday charts are finall
- Page 531 and 532: Page 523 intraday charts are finall
- Page 533 and 534: Page 525 consecutive times this occ
- Page 535 and 536: Page 527 differ considerably from t
- Page 537 and 538: Trix Steps (TrxStep) Philosophy Pag
- Page 539 and 540: Divergence Studies Page 531 Shaun D
- Page 541 and 542: AdxDiv Parameters Name Default Defi
- Page 543 and 544: CciDiv Parameters Name Default Defi
- Page 545 and 546: DmiDiv Parameters Name Default Defi
- Page 547 and 548: HvlDiv Parameters Name Default Defi
- Page 549 and 550: MacdDiv Parameters Name Default Def
- Page 551 and 552: MmDiv Parameters Name Default Defin
- Page 553 and 554: RcDiv Parameters Name Default Defin
- Page 555 and 556: Interpretation Page 547 Each moment
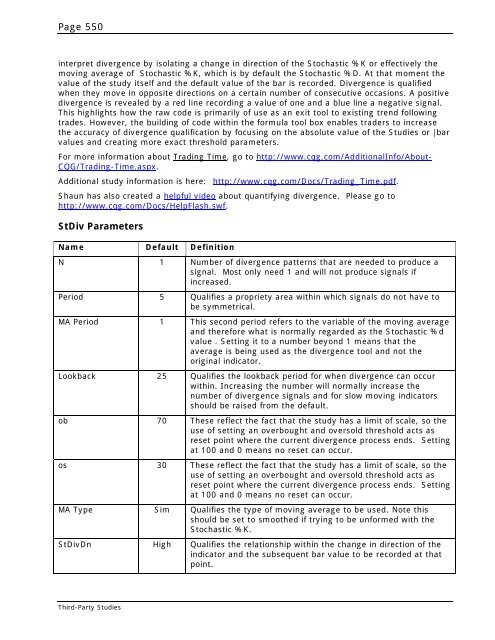
- Page 557: Stochastic Divergence (StDiv) Philo
- Page 561 and 562: TrxDiv Parameters Name Default Defi
- Page 563 and 564: Page 555 The second chart is a 30 m
- Page 565 and 566: SMR Studies Page 557 Momentum tradi
- Page 567 and 568: Page 559 This example below illustr
- Page 569 and 570: Trend Change Identification Methods
- Page 571 and 572: Page 563 Moving Average Method: Thi
- Page 573 and 574: Cluster: A Stop Loss Tool (SMRCtr)
- Page 575 and 576: Line Study (SMRLin) The SMR Line St
- Page 577 and 578: Page 569 Again, you always want to
- Page 579 and 580: SMR Turning Point Indicators (SMRDL
- Page 581 and 582: Page 573 The example below is a cha
- Page 583 and 584: Turning Point Parameters Page 575 T
- Page 585 and 586: Page 577 The SMR Dotted Line (DL) i
- Page 587 and 588: Timing Oscillator A (SMRTOA) "A" Bu
- Page 589 and 590: Timing Oscillator BC (SMRTOB) "B" B
- Page 591 and 592: "D-1" Buy Signal Page 583 • The c
- Page 593 and 594: Trading the SMR Oscillator Checklis
- Page 595: Are Your Stops Being Hit Too Often?
- Page 598 and 599: Page 590 "Using Stochastics to Fore
- Page 600 and 601: Page 592 Color Coded Support System
- Page 602 and 603: Page 594 Color Coded Support System
- Page 604 and 605: Page 596 Candlestick Indicators (KC
- Page 606 and 607: Page 598 Evening & Morning Star Pat
- Page 608 and 609:
Page 600 DevStop (KDevStp) The DevS
- Page 610 and 611:
Page 602 Peak Oscillator (KPO) The
- Page 612 and 613:
Page 604 Permission Screen (KPrmSc)
- Page 614 and 615:
Page 606 Permission Stochastic (KPr
- Page 616 and 617:
Page 608 Stop Amounts (KStpAm) The
- Page 618 and 619:
Page 610 Danger Signals and Related
- Page 621 and 622:
Supplemental Studies This category
- Page 623 and 624:
Tom Joseph Studies These studies in
- Page 625 and 626:
Page 617 For further information on
- Page 627 and 628:
Pivot (TJPvt) Page 619 There are tw
- Page 629 and 630:
Trend Index (TJTI) Page 621 The Tom