

QinetiQ Annual Report 2017

You also want an ePaper? Increase the reach of your titles
YUMPU automatically turns print PDFs into web optimized ePapers that Google loves.
112<br />
112<br />
Financial<br />
Financial statements<br />
statements <strong>QinetiQ</strong><br />
<strong>QinetiQ</strong> Group<br />
Group<br />
plc<br />
plc<br />
<strong>Annual</strong><br />
<strong>Annual</strong><br />
<strong>Report</strong><br />
<strong>Report</strong><br />
and<br />
and<br />
Accounts<br />
Accounts<br />
<strong>2017</strong><br />
<strong>2017</strong><br />
www.qinetiq.com<br />
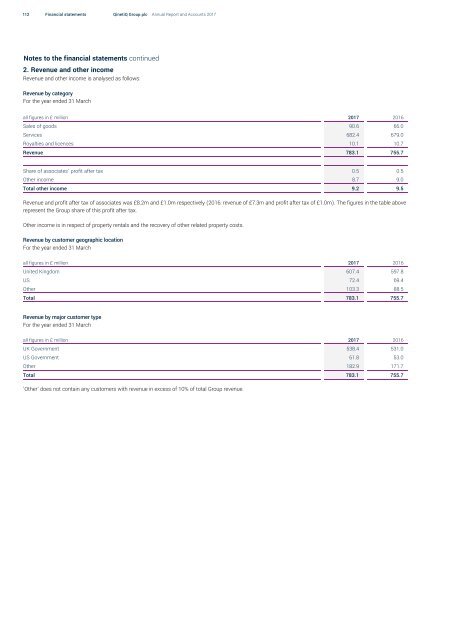
Notes to the financial statements continued<br />
2. Revenue and other income<br />
Revenue and other income is analysed as follows:<br />
Revenue by category<br />
For the year ended 31 March<br />
all figures in £ million <strong>2017</strong> 2016<br />
Sales of goods 90.6 66.0<br />
Services 682.4 679.0<br />
Royalties and licences 10.1 10.7<br />
Revenue 783.1 755.7<br />
Share of associates’ profit after tax 0.5 0.5<br />
Other income 8.7 9.0<br />
Total other income 9.2 9.5<br />
Revenue and profit after tax of associates was £8.2m and £1.0m respectively (2016: revenue of £7.3m and profit after tax of £1.0m). The figures in the table above<br />
represent the Group share of this profit after tax.<br />
Other income is in respect of property rentals and the recovery of other related property costs.<br />
Revenue by customer geographic location<br />
For the year ended 31 March<br />
all figures in £ million <strong>2017</strong> 2016<br />
United Kingdom 607.4 597.8<br />
US 72.4 69.4<br />
Other 103.3 88.5<br />
Total 783.1 755.7<br />
Revenue by major customer type<br />
For the year ended 31 March<br />
all figures in £ million <strong>2017</strong> 2016<br />
UK Government 538.4 531.0<br />
US Government 61.8 53.0<br />
Other 182.9 171.7<br />
Total 783.1 755.7<br />
‘Other’ does not contain any customers with revenue in excess of 10% of total Group revenue.


